

A Beginner’s Guide to Building a Dividend Growth Portfolio
MP Market Review - February 10, 2026

Summary
This is not a stock-picking newsletter.
It’s a behind-the-scenes look at how a dividend growth portfolio is built, maintained, and improved over time.
Welcome to this week’s MP Market Review. Each week, we track the Canadian dividend growth companies on The List, our curated watchlist of businesses designed to produce rising income. While we also publish a U.S. edition monthly, Canada remains our training ground.
Our objective is simple: grow dividend income by 7–10%+ annually while delivering capital appreciation that matches or exceeds the TSX Composite in Canada and the S&P 500 for our U.S. investors over a full market cycle.
What you’re about to read isn’t theory. It’s the real-time application of a dividend growth strategy using real money, with a clear objective: growing income first and letting capital growth follow.
Markets generate a lot of noise. We ignore most of it.
Instead, we track a small set of metrics that tell us whether our dividend growth strategy is working in real time. No forecasts. No opinions. Just results.
Here they are:
Dividend income from The List: +3.3% year-to-date
Capital value: +2.2% year-to-date
Dividend announcements last week: One
Earnings reports last week: One
Earnings reports this week: Eight
DGI Clipboard
“I don’t know where we are going, but I know exactly how to get there.”
- Boyd Varty
A Beginner’s Guide to Building a Dividend Growth Portfolio
Intro
How We Build Portfolios
Dividend growth investing works best when it is treated as a process, not a prediction. Every portfolio we manage is built using the same repeatable framework designed to prioritize quality, discipline, and long-term income growth.
This article outlines exactly how we do it.
Step 1: Start With a Curated Candidate List
Every holding begins on a carefully curated candidate list. This list is not static. Companies move on and off as fundamentals, valuations, and dividend policies evolve.
Each candidate is evaluated on:
Business quality and durability
Financial strength and balance sheet health
Dividend history, sustainability, and growth potential
Long-term earnings visibility
Only companies that meet our quality standards are eligible for inclusion.
Step 2: Assign Quality Ratings and Categories
Once a company qualifies, it is assigned a quality rating and placed into one of two categories: Core or Non-Core.
Core holdings are essential businesses with durable competitive advantages, consistent cash flow, and shareholder-friendly dividend policies. These companies form the backbone of the portfolio and are expected to deliver reliable income growth across full market cycles.
Non-Core holdings are typically smaller or faster-growing businesses that enhance overall dividend growth. They offer higher upside potential but tend to carry more variability than Core holdings.
This classification determines how much capital we are willing to allocate.
Step 3: Define Position Size Before Capital Is Deployed
Position sizing is decided before any trade is made. This removes emotion from the process and enforces discipline.
Maximum position size
Core holdings: up to 8%
Non-Core holdings: up to 5%
These limits allow us to hold approximately 15 to 20 high-quality companies while maintaining meaningful concentration in our strongest ideas.
The goal is not diversification for its own sake. The goal is owning the best businesses at sensible weights.
Step 4: Use Minimum Position Sizes to Stay Invested
Minimum position sizes are just as important as maximums.
Our minimum position size, for our Canadian portfolio, ranges from 1% to 4%, depending on category.
This approach serves two purposes:
It prevents overexposure when valuation or near-term fundamentals are less favourable
It ensures we maintain exposure to high-quality businesses we want to own long-term
Once a company meets our standards, we stay invested and build positions deliberately over time as opportunities improve.
Step 5: Adjust, Not React
The portfolio is monitored continuously, but changes are made deliberately. Charts, ratings, and categories may be updated throughout the year as new information becomes available.
Nothing here is fixed forever. The framework is consistent, but the inputs evolve.
Always refer to the “Last Updated” date on any portfolio chart or list for the most current view.
Transparency for Paid Subscribers
Paid subscribers receive DGI Alerts whenever we initiate or add to a position in the model portfolio.
Each alert includes:
The execution price
The recommended position size
The rationale behind the decision
This allows subscribers to follow the process in real time and apply the same discipline to their own portfolios.
Takeaway
This is not about chasing returns or timing markets.
It is about owning high-quality businesses, sizing positions intelligently, and letting rising dividends do the heavy lifting over time.
Think like an owner.
Build deliberately.
Let income growth lead.
Become a paid partner, and I’ll show you exactly how I do it. With real money. In real stocks. In addition, gain full access to this post and exclusive, subscriber-only content. We do the work; you stay in control.
DGI Scorecard
The Magic Pants 2026 list (The List) includes 26 Canadian dividend growth stocks, and our new American watchlist (The List-USA) contains 28 companies. Here are the criteria to be considered a candidate on our watchlists:
Dividend growth streak: 10 years or more.
Market cap: Minimum one billion dollars.
Diversification: Limit of five companies per sector, preferably two per industry.
Cyclicality: Exclude REITs and pure-play energy companies due to high cyclicality.
Based on these criteria, companies are added or removed from ‘The List’ annually on January 1. Prices and dividends are updated weekly.
‘The List’ is not a portfolio but a coaching tool that helps us think about ideas and risk manage our model portfolio. We own some but not all the companies on ‘The List’. In other words, we might want to buy these companies when valuation looks attractive.
Our newsletter provides readers with a comprehensive insight into the implementation and advantages of our dividend growth investing strategy. This evidence-based, unbiased approach empowers DIY investors to outperform both actively managed dividend funds and passively managed indexes and dividend ETFs over longer-term horizons.
Note: In the last week of every month, I will show the updated watchlist for our American dividend growers, The List-USA. It will be shown after the Canadian watchlist below.
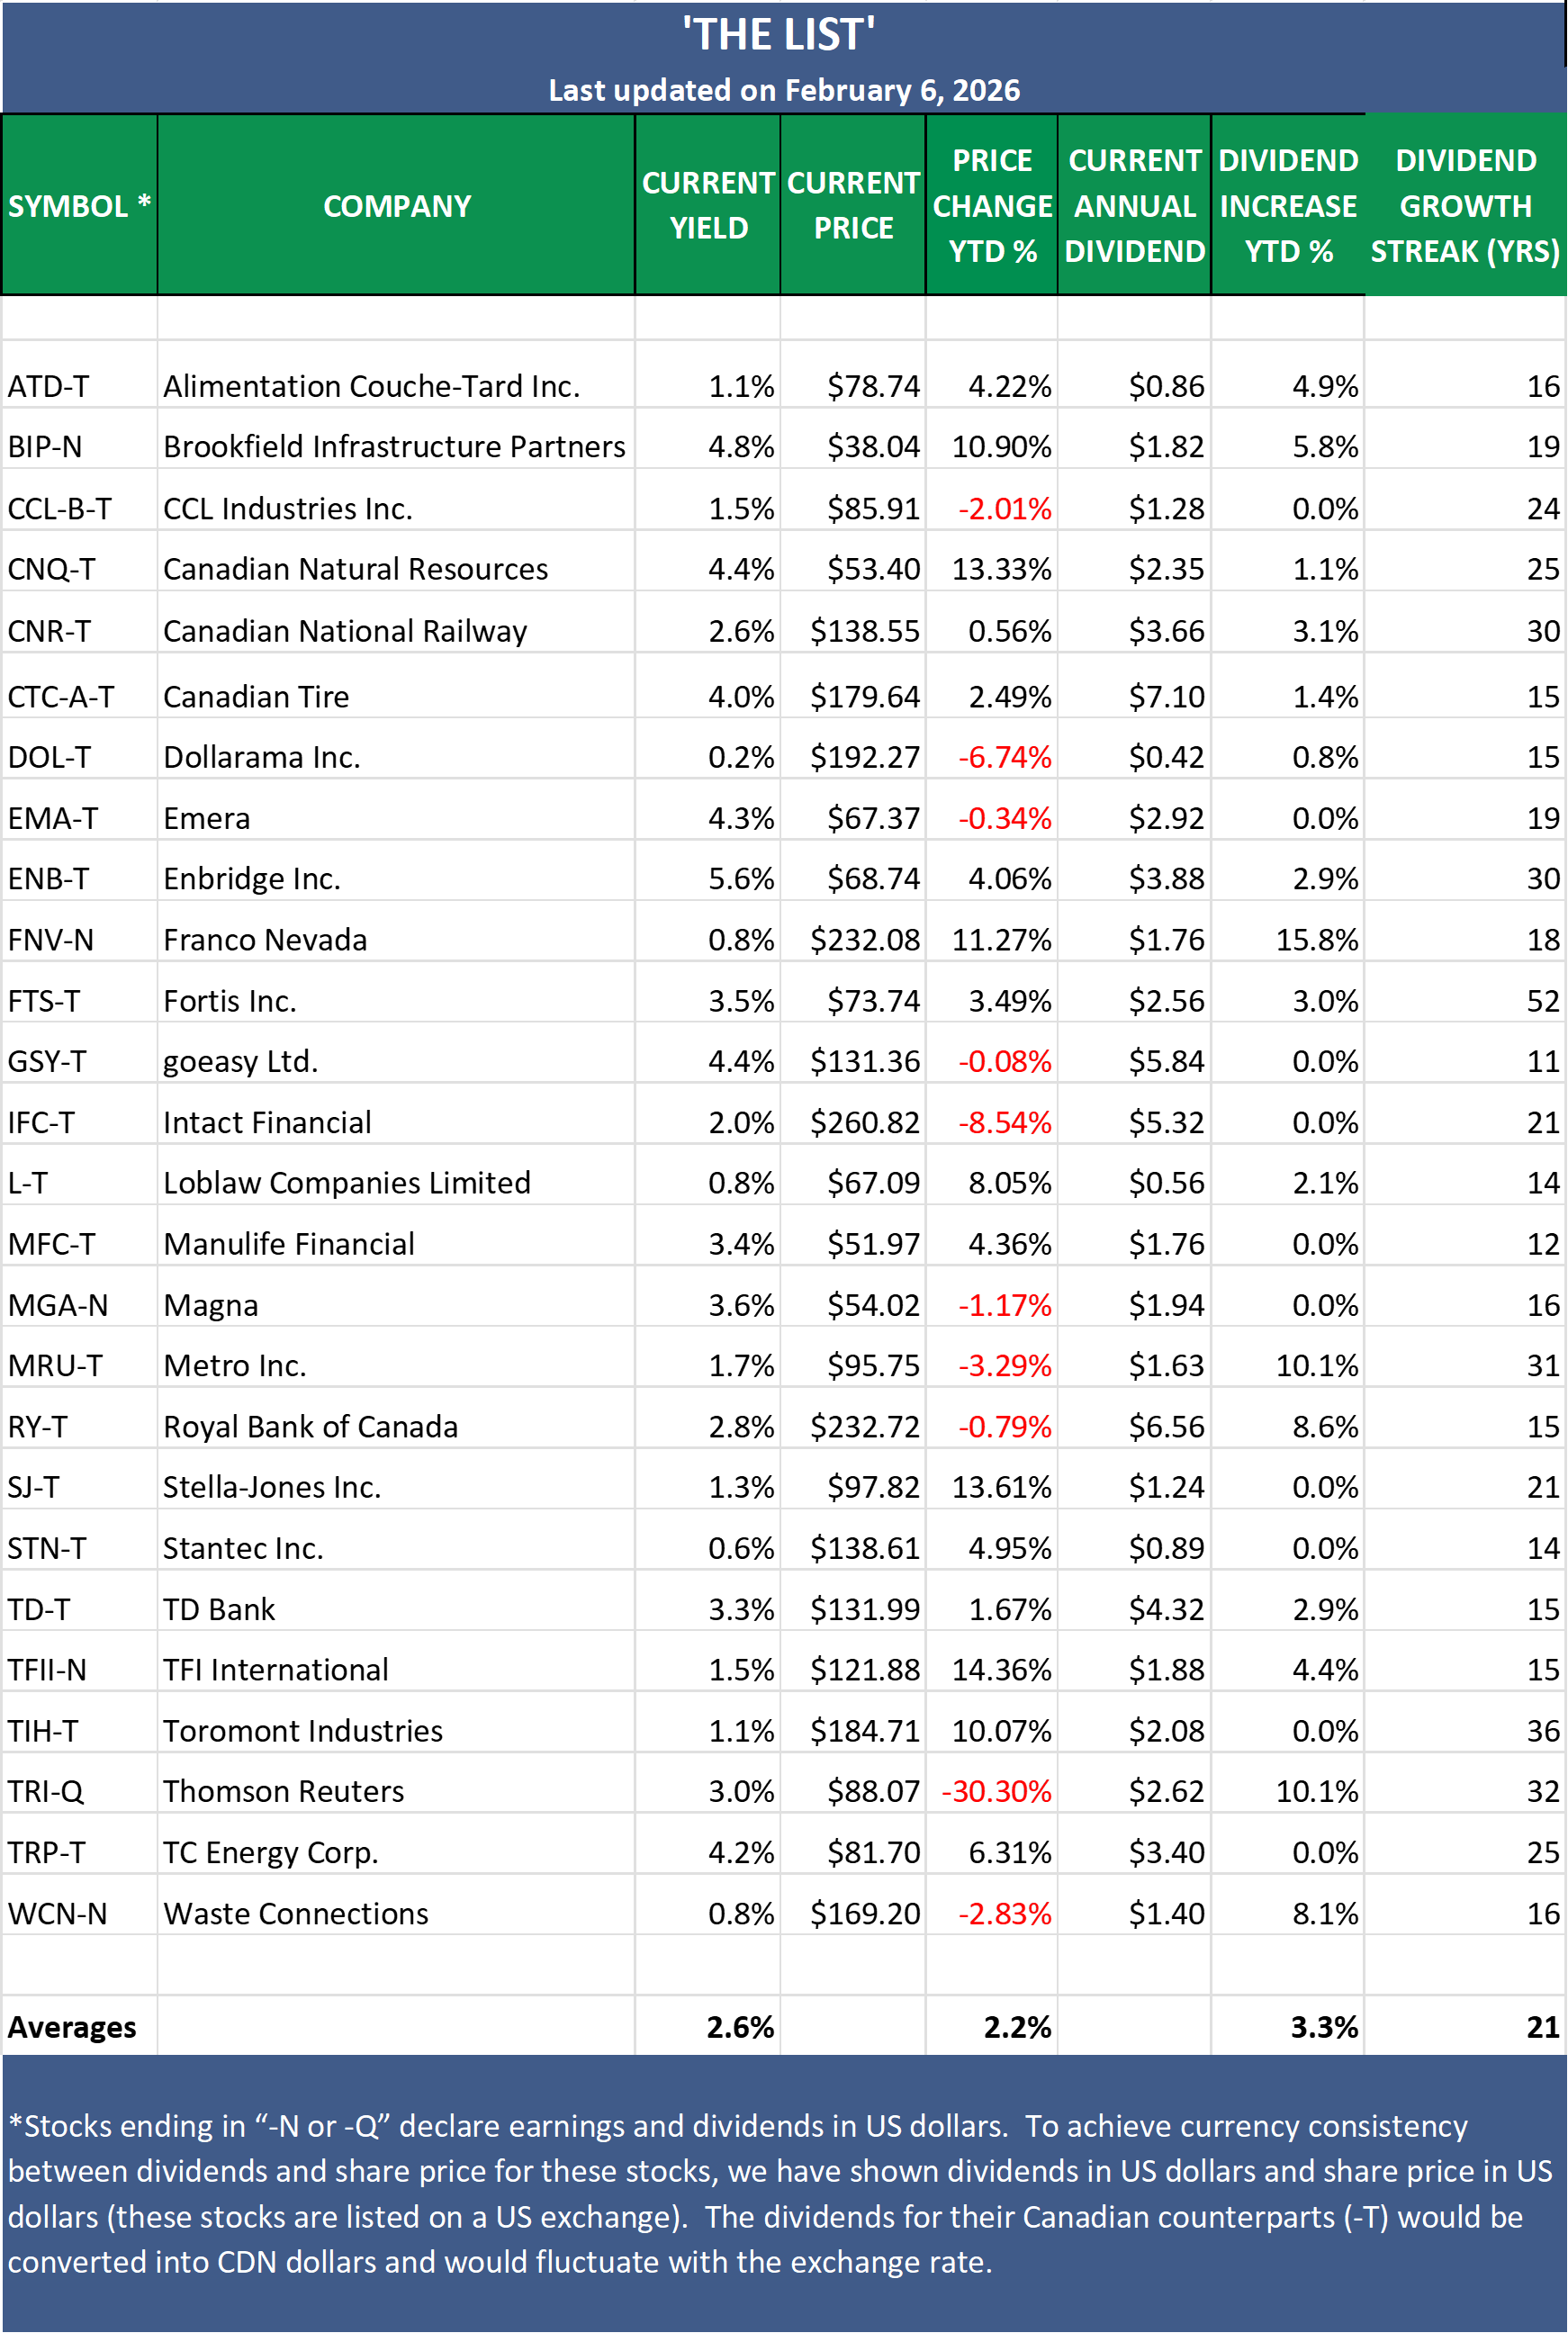
Performance of 'The List'
Dividend growth of The List continued to climb with an average increase YTD of +3.3% (income). These are dividends announced late last year and early in 2026.
The price of The List went up last week and now stands at +2.2% YTD (capital).
Top Performers Last Week:
TFI International (TFII-N), up +13.32%.
Alimentation Couche-Tard Inc. (ATD-T), up +11.15%.
Loblaw Companies Limited (L-T), up +9.5%.
Worst Performer Last Week:
Thomson Reuters (TRI-Q), down -20.39%.
From breaking news to quarterly earnings reports, we break down the week’s biggest headlines to help you make sense of the market.
