


We do not predict where prices will go next. We invest in companies that give prices a reason to rise over time.
Welcome to this week’s MP Market Review, where we put our dividend growth investing (DGI) process into practice with real money, real positions, and real results.
This week, we take a closer look at dividend return, the return generated by the dividend alone.
As dividend growth investors, we separate investment returns into two camps:
Dividends provide cash today.
Capital gains increase the value of your shares.
Under the Magic Pants dividend growth investing philosophy, we do not view them as competing forms of return. They are connected outcomes of owning a successful and growing business.
IN THIS ISSUE: DGI Clipboard • DGI Scorecard • DGI News • DGI Updates • Earnings Releases
DGI Clipboard
“The true investor… will do better if he forgets about the stock market and pays attention to his dividend returns.”
- Benjamin Graham
Dividend Return vs. Capital Return: Which Matters More?
Dividend growth investors often divide returns into two separate camps: dividends and capital gains.
One provides cash today. The other appears as a higher share price.
Under the Magic Pants dividend growth investing philosophy, however, they are not competing forms of return. They are two outcomes of owning a successful business.
Growing dividends provide the income. Growing businesses create the capital appreciation.
The Dividend Return
A dividend return is tangible. It is cash deposited directly into your account without requiring you to sell a single share.
More importantly, when a company increases its dividend year after year, the income generated by your original investment continues to grow, regardless of what the stock market is doing.
Share prices may fluctuate, but the dividend keeps arriving.
That growing income stream lets dividend growth investors stay patient during periods of market volatility. We are being paid while we wait for the market to recognize the value of the businesses we own.
The Capital Return
Capital return is different. It depends on what another investor is willing to pay for your shares.
In the short term, stock prices can rise or fall because of interest rates, economic forecasts, investor sentiment, or the latest headline. These movements are difficult, if not impossible, to predict consistently.
Dividends give us something more dependable to measure.
We look for high-quality companies with a history of growing earnings, cash flow, and dividends. We then wait patiently for an attractive valuation that provides a reasonable starting yield and the potential for future dividend growth.
This does not mean capital appreciation is unimportant. It means we believe the most dependable capital growth comes from rising business fundamentals and a growing dividend.
We do not predict where prices will go next. We invest in companies that give prices a reason to rise over time.
The Advantage of Control
The key difference between dividend return and capital return is control.
Investors relying entirely on capital gains must sell shares to create income. That can become uncomfortable during a market decline, particularly when living expenses force them to sell at an unfavourable time.
Dividend growth investors receive income without predicting where prices are headed or deciding which shares to sell.
The dividend arrives while the investor still owns the asset.
That is the foundation of the Magic Pants approach. Build a reliable, growing income stream first, then let capital appreciation follow.
What $10,000 Invested in 2016 Produced
To illustrate the dividend return component, let’s examine the dividends generated over the past ten years by companies on The List entering 2026.
The chart below assumes that $10,000 was invested in each company on January 1, 2016. It then shows the total dividend income generated by each investment over the following decade along with the 10-year dividend return as of January 1, 2026.
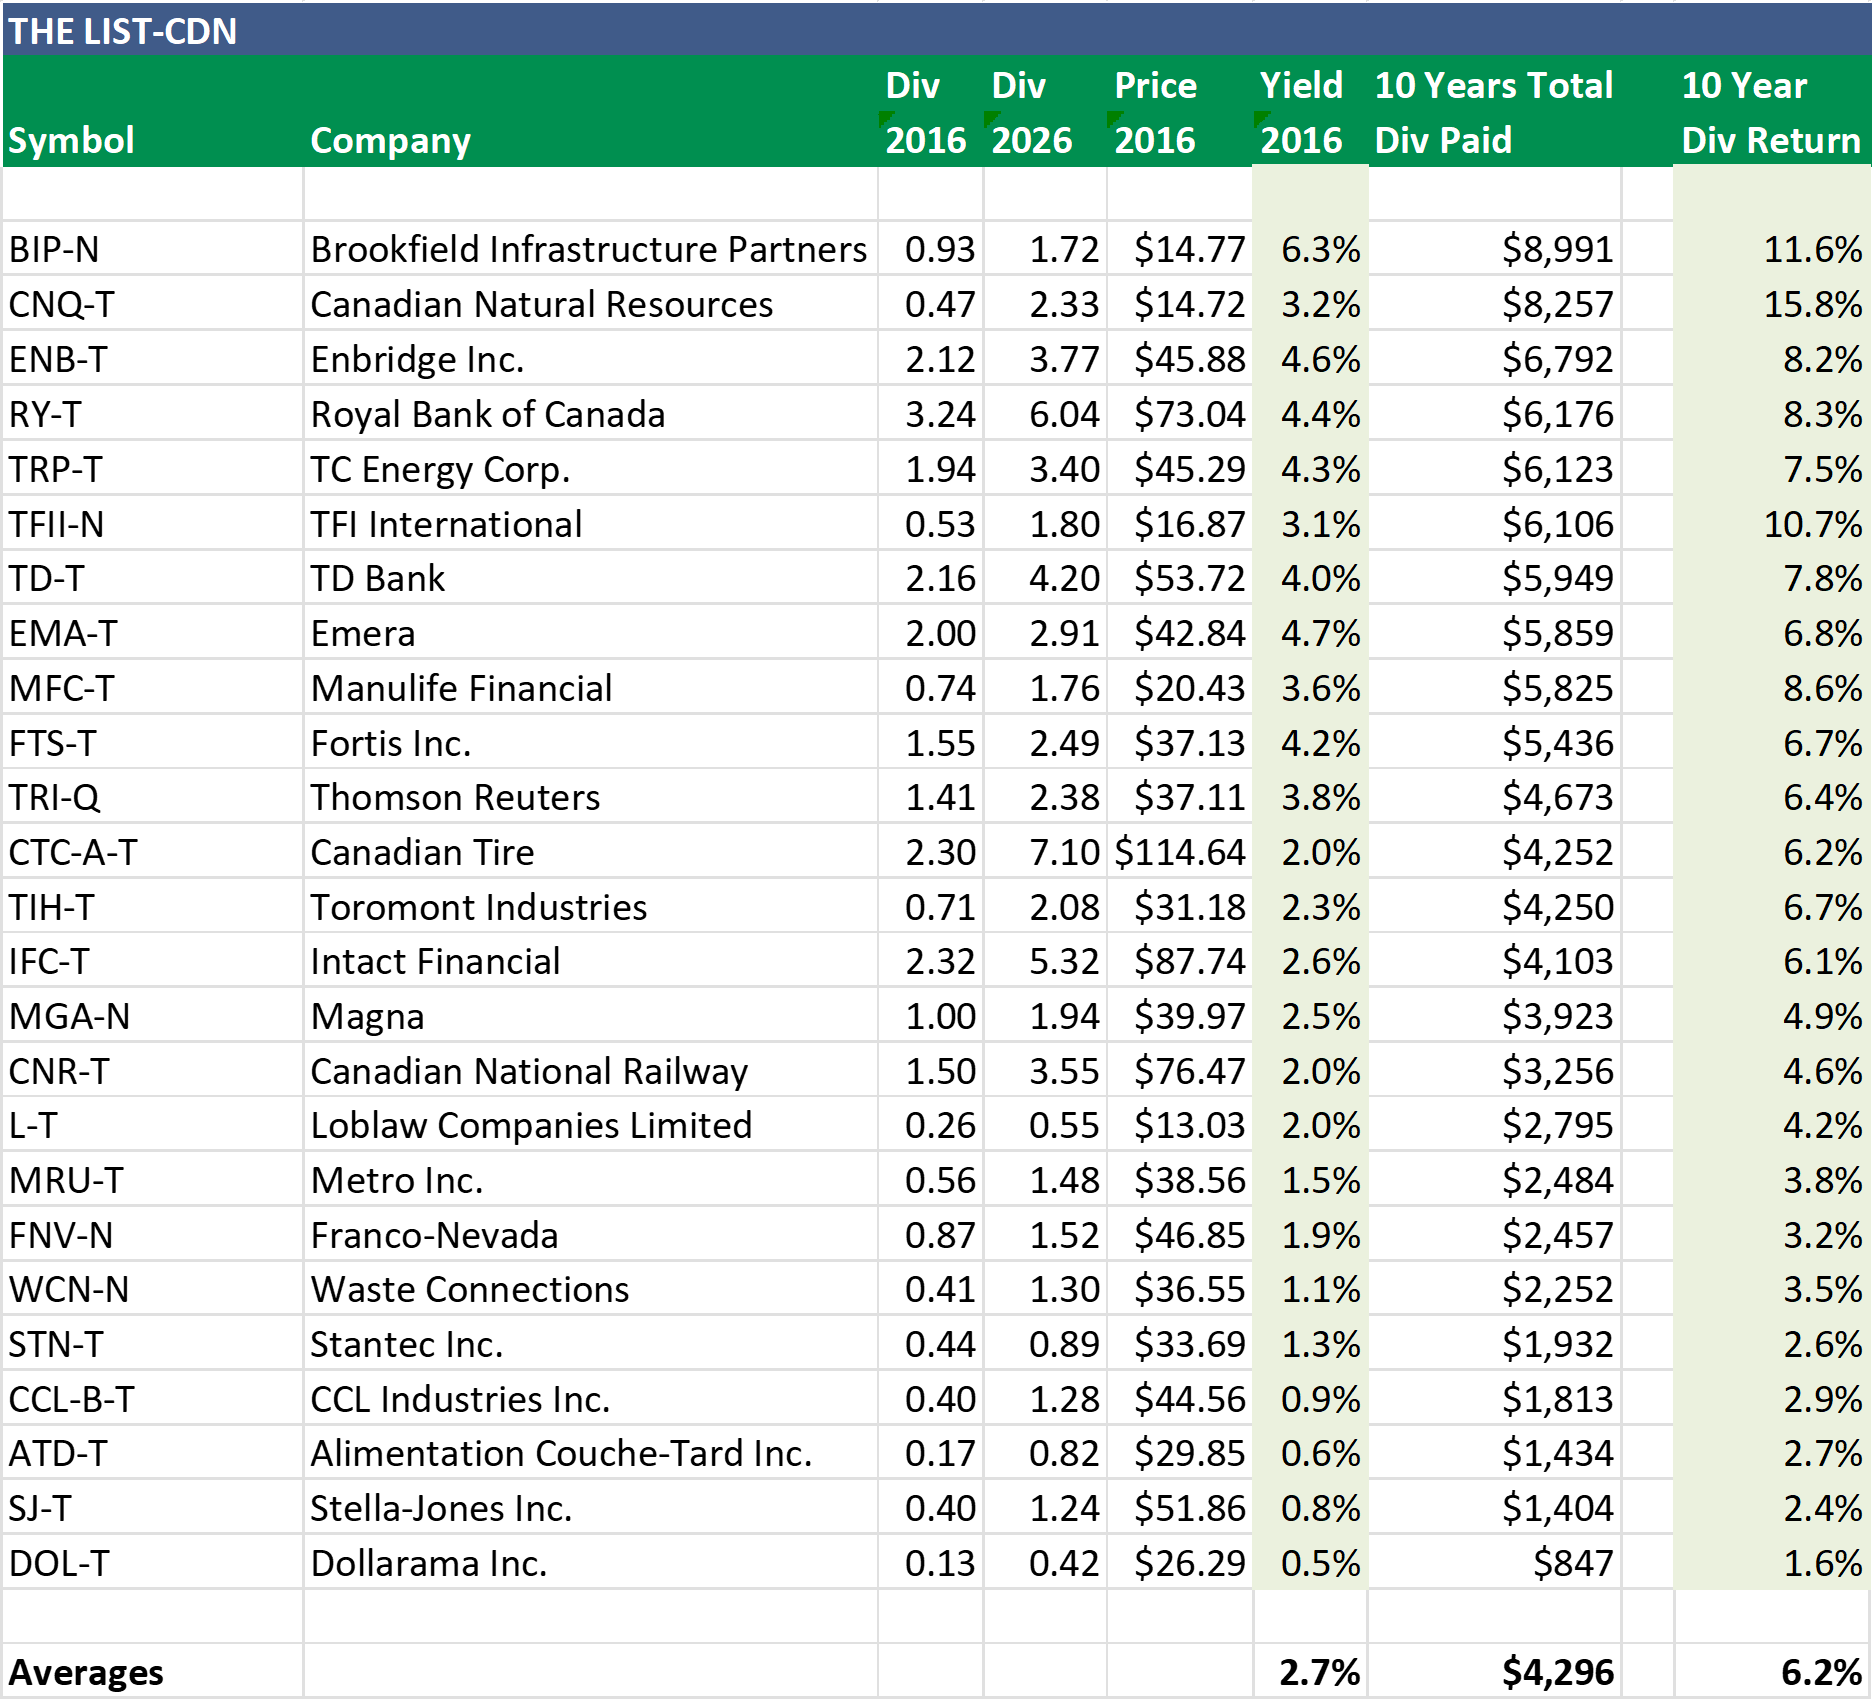
The chart ranks each company by total dividends paid over those ten years.
On average, each $10,000 investment would have generated $4,296 in dividends, returning approximately 43% of the original investment in cash.
Starting yield played an important role in the amount of income collected during the early years. However, it won’t take long for our lower-yielding, faster-growing companies to close the gap.
That is why we don't simply chase the highest yield available today.
Starting yield determines where your income begins. Dividend growth determines where it goes.
The Income Keeps Growing
Today, those original investments collectively generate (on average) annual dividend income equal to 6.2% of their original cost.
This is often referred to as yield on cost (we like to call it growth yield). Compare this to a GIC or bond, which maintains the same yield for the life of the investment.
Better yet, that dividend return continues to rise with every increase. The investor does not have to contribute another dollar or sell a single share for the income to keep growing.
It may not be long before a dividend growth portfolio built from companies on The List generates annual dividend income exceeding 7%-10% of its original investment, before including any capital appreciation.
Why Is 7% Significant?
Historically, the stock market has generated a long-term total return of approximately 7% after inflation. That return, however, includes both dividends and capital appreciation.
Now imagine eventually generating an amount equal to that historical total return from dividends alone, while continuing to own the shares and participate in their future growth.
The dividend income is deposited into your account.
The shares remain in your portfolio.
The businesses continue to grow.
And every dividend increase raises the return on your original investment.
Takeaway
Our objective is not to choose dividend return over capital return.
It is to invest in quality businesses, purchase them at attractive valuations, and build a dependable income stream that grows year after year. As earnings and dividends rise, capital appreciation should eventually follow.
One return pays us to wait.
The other rewards us for being patient.
DGI Scorecard
MP Wealth-Builder Model Portfolio (Canada)
Annualized Total Return: +17.19% since inception
Total Return (includes dividends): +16.83 % year-to-date
Dividend Growth: 7.0% year-to-date
Growth Yield: 3.2%
(Inception May 1, 2022, to July 31, 2026. Returns are actual results of our model portfolio in CAD with dividends reinvested.)
This Week’s Highlights
The List (Canada)
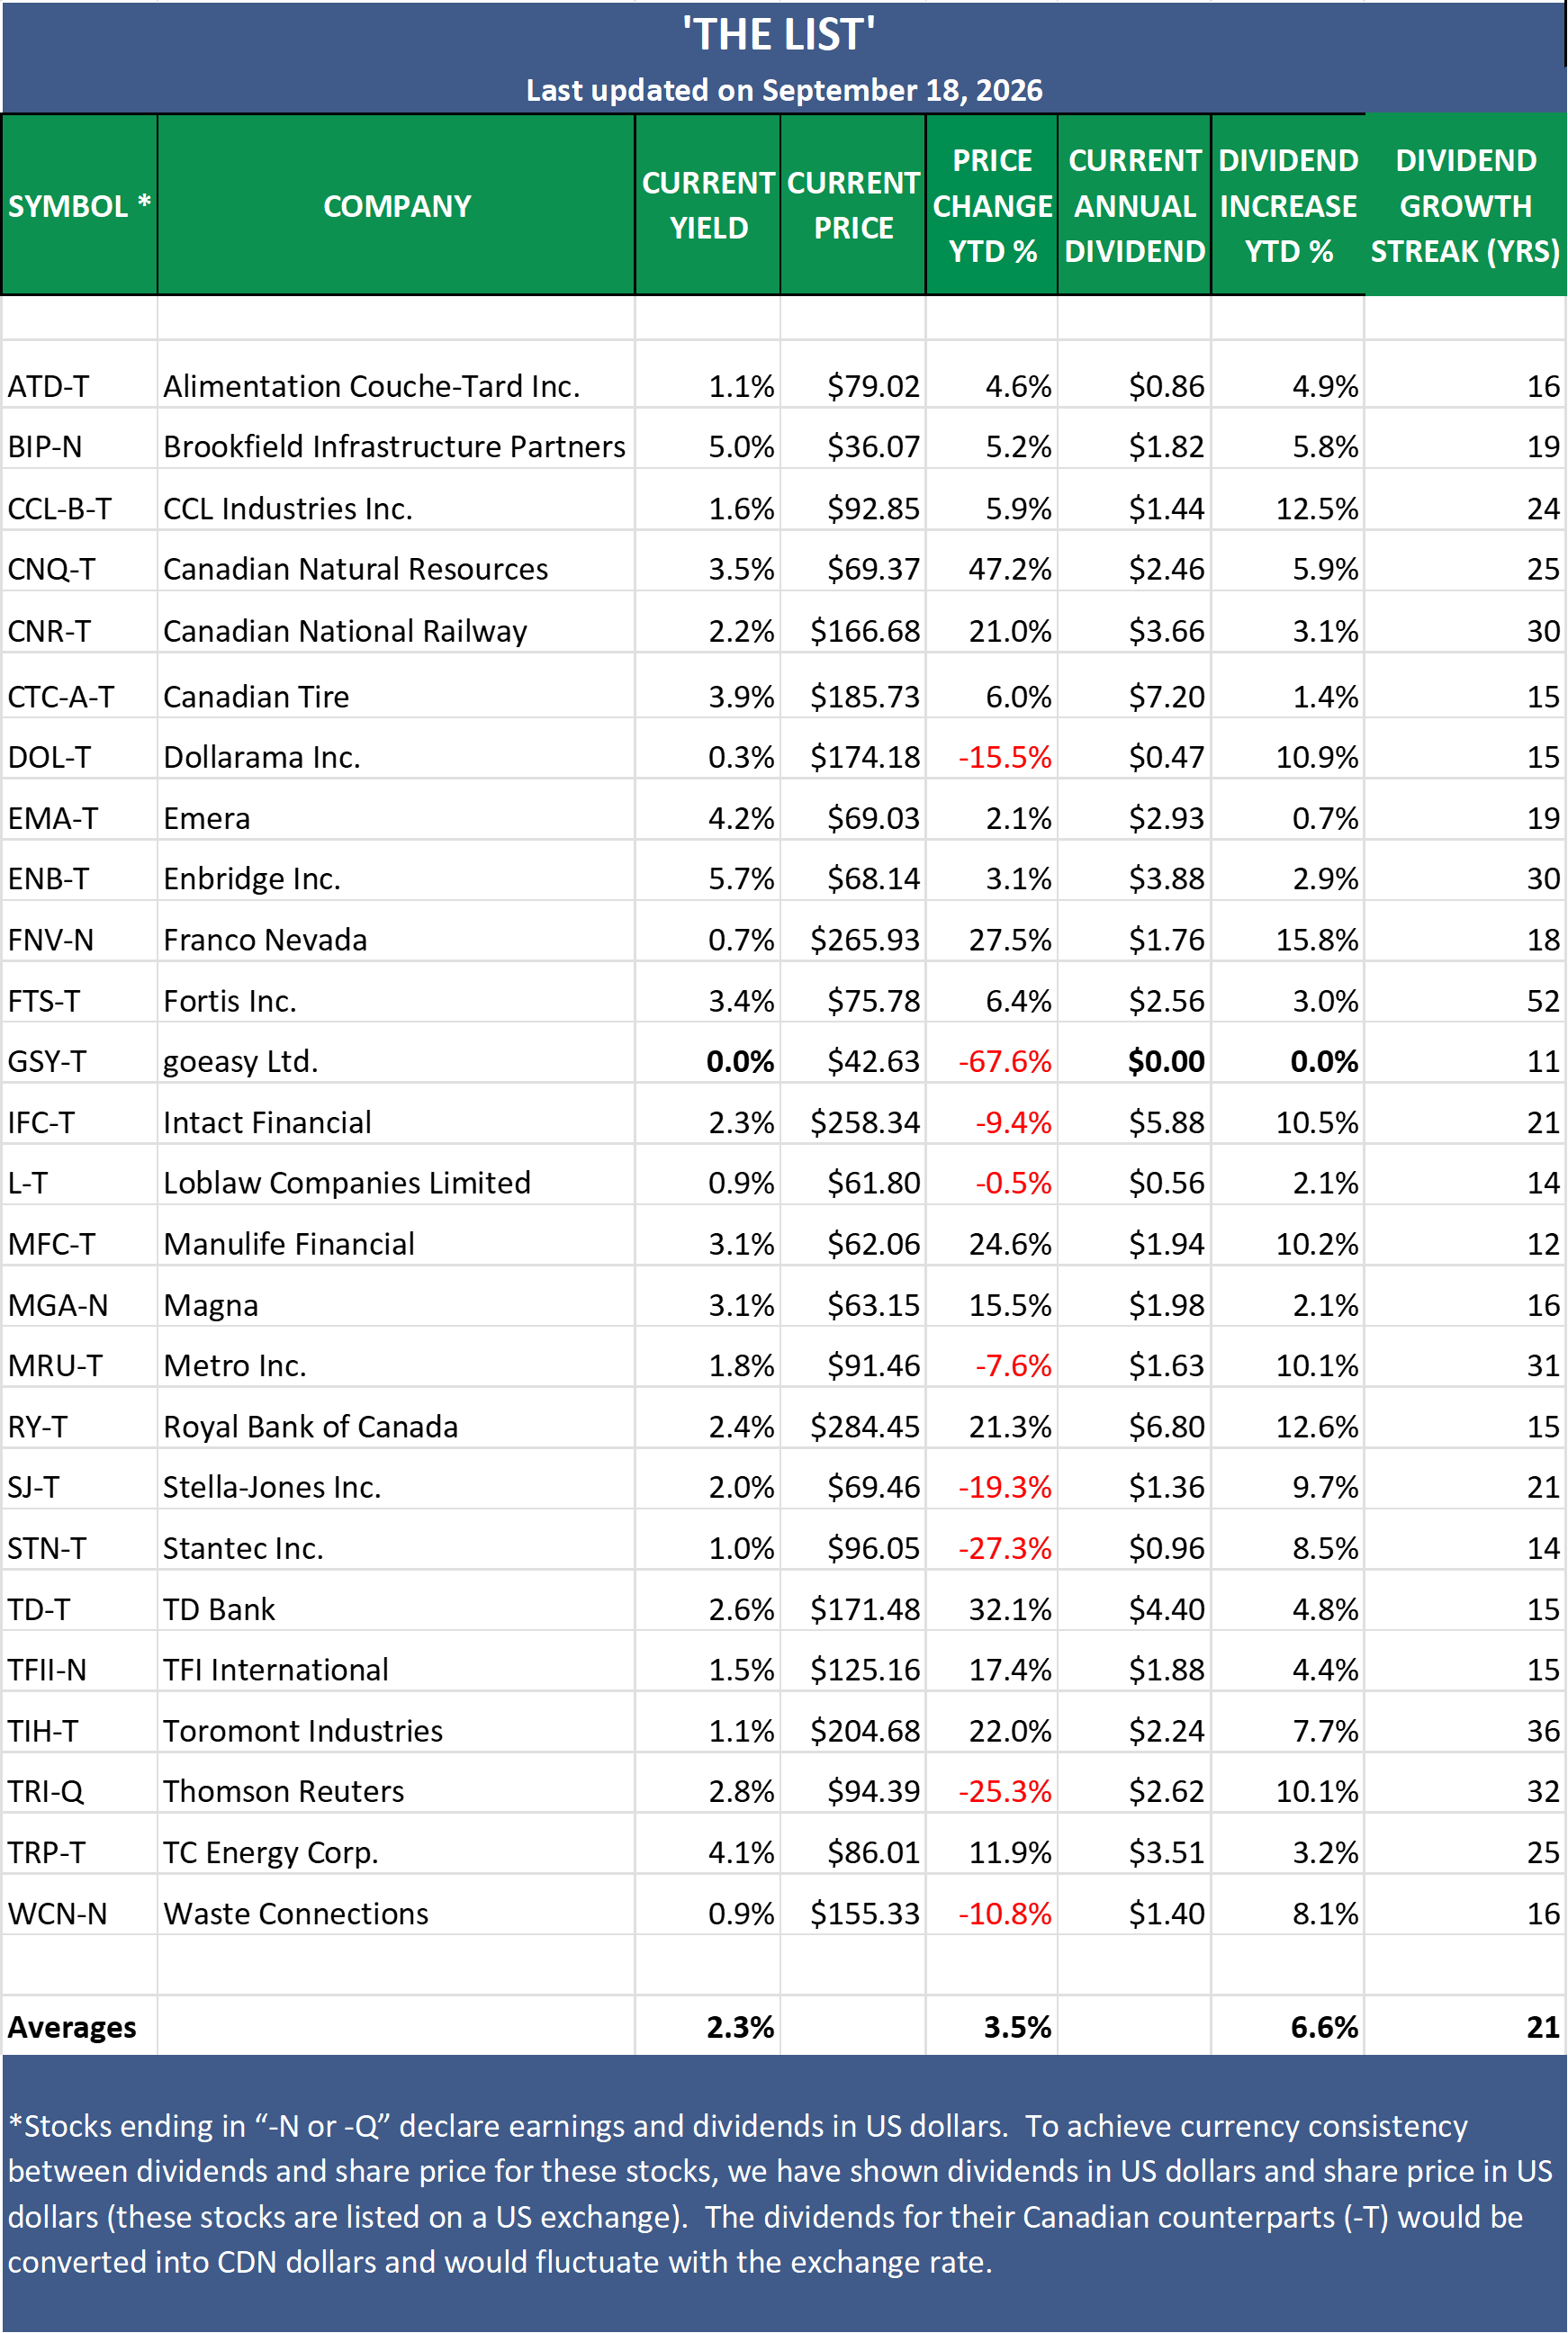
Dividend Income Growth: +6.6% year-to-date
Capital Appreciation: +3.5% year-to-date
Dividend Announcements Last Week: None
Earnings Reports Last Week: One
Earnings Reports This Week: None
Top Performers Last Week:
Dollarama Inc. (DOL-T), up +4.23%.
Metro Inc. (MRU-T), down +3.74%.
Stella-Jones Inc. (SJ-T), down +3.67%.
Worst Performer Last Week:
TFI International (TFII-N), down -4.63%.
Watchlists
The Magic Pants 2026 list (The List) includes 26 Canadian dividend growth stocks, and our new American watchlist (The List-USA) contains 28 companies. Here are the criteria to be considered a candidate on our watchlists:
Dividend growth streak: 10 years or more.
Market cap: Minimum one billion dollars.
Diversification: Limit of five companies per sector, preferably two per industry.
Cyclicality: Exclude REITs and pure-play energy companies due to high cyclicality.
Based on these criteria, companies are added or removed from The List annually on January 1. Prices and dividends are updated weekly.
The watchlists are not a portfolio but a coaching tool that helps us think about ideas and manage risk in our model portfolio. We own some, but not all, of the companies on these watchlists. In other words, we might want to buy these companies when valuation looks attractive.
Our newsletter provides readers with a comprehensive insight into the implementation and advantages of our dividend growth investing strategy. This evidence-based, unbiased approach empowers DIY investors to outperform both actively managed dividend funds and passively managed indexes and dividend ETFs over longer-term horizons.
In the last week of every month, I will show the updated watchlist for our American dividend growers (The List-USA). I will show the watchlist after the Canadian watchlist above.
New to Magic Pants?
Magic Pants Dividend Growth Investing is a behind-the-scenes look at how we build, maintain, and improve a dividend growth portfolio using real money, real positions, and real results.
Our objective is to grow dividend income by 7-10%+ annually while achieving long-term capital appreciation that matches or exceeds the broader market over a full investing cycle.
The name comes from a simple idea: when a quality company pays a dividend, cash moves from the company’s pocket to yours while your ownership stake remains intact. As earnings and dividends grow, the compounding cycle can accelerate. That’s the magic.
Build Your Own Growing Income Machine
Looking for a helping hand in the market? Members of Magic Pants Dividend Growth Investing receive exclusive ideas and guidance designed to help navigate changing market conditions.
The Magic Pants model portfolios (Canadian and American) are real-money, dividend-growth portfolios funded with actual capital and executed in live accounts. We own, size, and track every position in real time using our disciplined DGI process.
Become a paid subscriber and see exactly how we put the process into practice. You’ll also receive full access to this post and exclusive subscriber-only content.
We do the work. You stay in control.
From breaking news and quarterly earnings to the latest dividend announcements, we highlight what matters most and explain what it means for dividend growth investors.
