


Strong earnings reinforce our confidence in the businesses. Valuation helps us decide how much to own.
Welcome to this week’s MP Market Review, where we put our dividend growth investing (DGI) process into practice with real money, real positions, and real results.
This week, we turn to Royal Bank and TD Bank, two of the largest holdings in our Canadian model portfolio. Following another strong earnings report, we revisit two valuation measures: dividend growth versus price growth and historical dividend yields.
The results reinforce our confidence in these businesses. But as shareholders, we also need to ask:
How much of that success is already reflected in today’s share prices?
IN THIS ISSUE: DGI Clipboard • DGI Scorecard • DGI News • DGI Updates • Earnings Releases
DGI Clipboard
“Measuring performance without simultaneously measuring valuation is a job half done.”
-Chuck Carnevale
Great Companies. But at What Price?
Strong earnings reinforce our confidence in the businesses. Valuation helps us decide how much to own.
Most of the time, we use our dividend growth valuation metrics to identify opportunities to buy quality companies at sensible prices.
Our intended holding period? Forever, provided the dividend continues to grow and the underlying business remains sound.
But a long-term mindset does not mean ignoring valuation. Even a great company can become expensive, and a successful investment can grow into a larger position than we intended.
Quality determines what we want to own. Valuation and position sizing help us decide when to buy, hold, or trim.
Following another positive earnings report from our Canadian bank holdings, we are revisiting two valuation measures for Royal Bank and TD Bank: dividend growth versus price growth and historical dividend yields.
Dividends Lead. Prices Follow.
Over time, we expect a growing dividend to be supported by growing earnings. Share prices tend to reflect that progress, although they rarely move in a straight line.
Comparing dividend growth with price growth helps us identify periods when the share price may have moved ahead of, or fallen behind, the company’s dividend growth.
Historical Dividend Growth vs. Price Growth
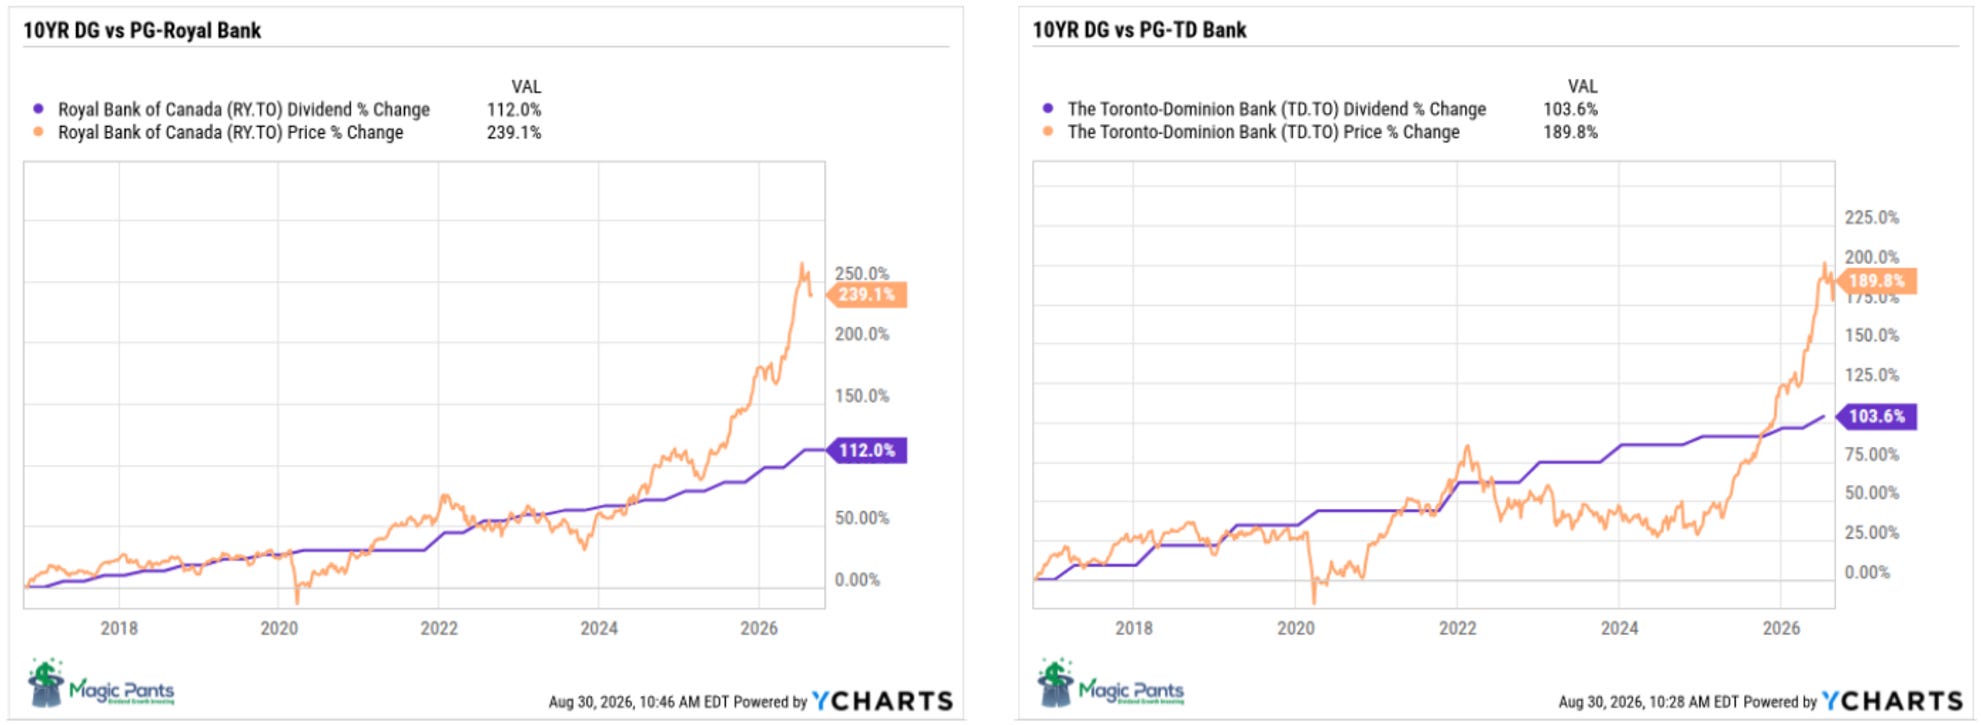
Both banks have shown a historical relationship between dividend growth and price growth. Periods when those paths diverged offered reasons to look more closely at valuation.
TD experienced the more pronounced swings, particularly in 2020 and 2024. Royal Bank showed a similar pattern, although its deviations were less dramatic.
These gaps are signals to investigate, rather than automatic instructions to buy or sell. A lower price can represent an opportunity, but it can also reflect a deterioration in the business.
It was no coincidence that we initiated positions and added to them during periods of weakness. Our process helped us recognize attractive valuations when uncertainty weighed on prices.
A Second Lens: Dividend Yield Theory
Historical dividend yields offer another way to assess valuation.
Dividend Yield Theory compares a company’s current yield with its historical range. When the yield rises above its usual level, shares may be attractively priced, provided the dividend remains sustainable and the business outlook supports it. When the yield falls below that range, shares may be becoming expensive.
Historical Dividend Yields
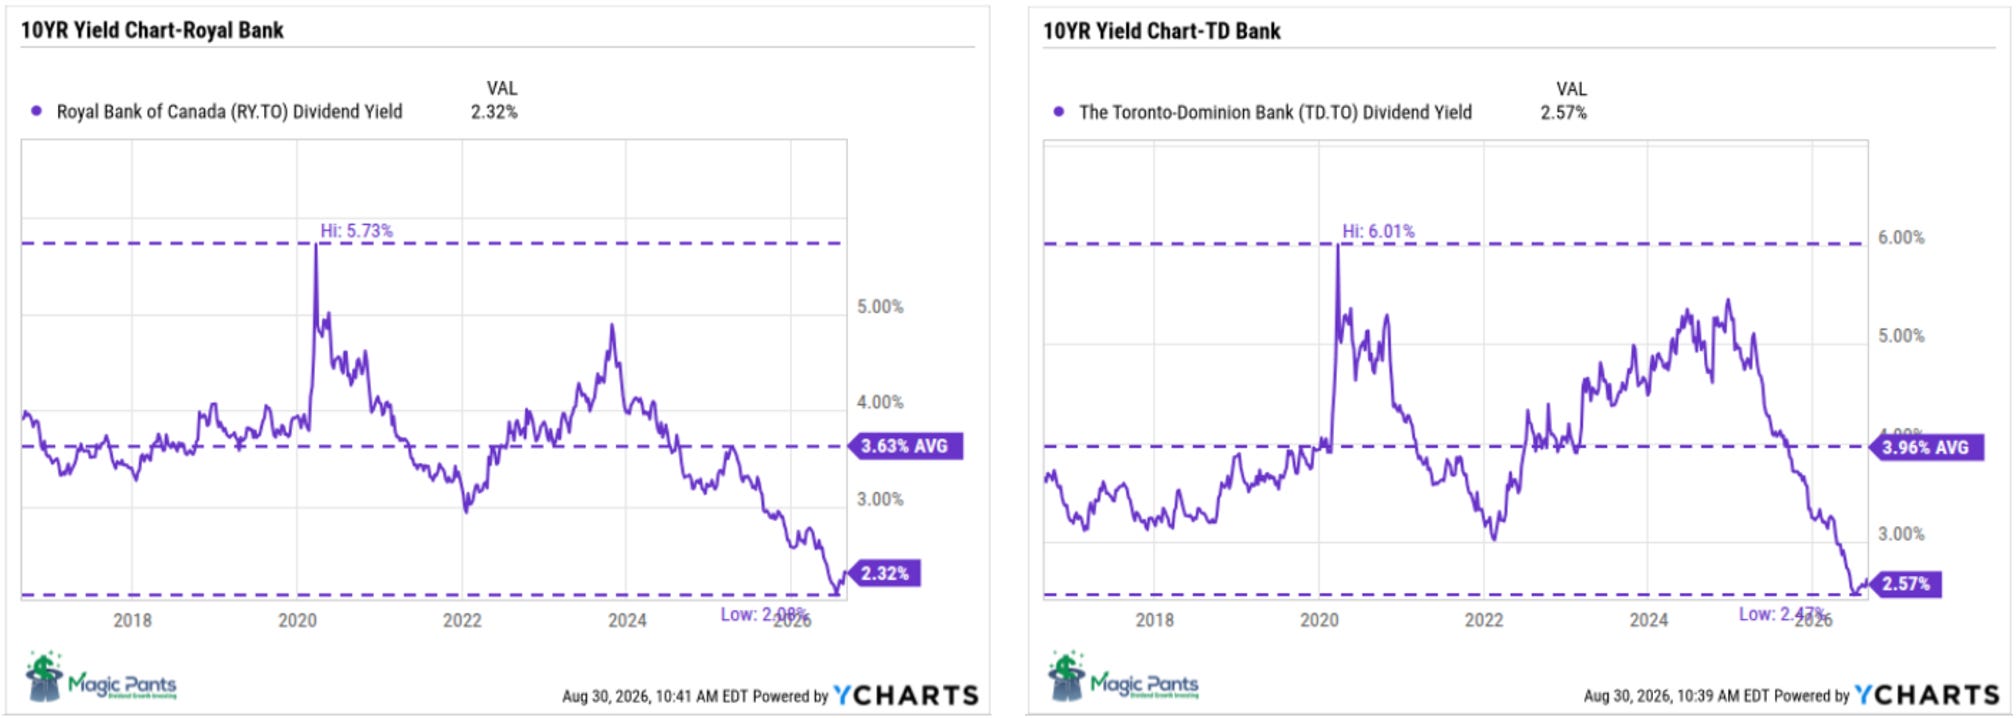
The yield charts tell a story similar to that of the dividend growth versus price growth charts.
In 2020 and 2024, yields climbed as share prices came under pressure. As prices recovered, yields moved back toward their historical averages and subsequently lower.
That pattern supported our buying decisions. However, historical averages are reference points, not guarantees. Changes in growth prospects, interest rates, or business risk can justify a different valuation.
More Income. More Capital.
Buying at lower prices allowed us to capture higher starting yields and participate in the subsequent share-price recovery.
We benefited in two ways: higher dividend income per dollar invested and capital appreciation as valuations recovered.
Both banks have continued to grow their dividends, with their recent increases broadly consistent with their longer-term growth rates.
That is the combination we are looking for: a quality business, purchased at a sensible price, that pays us more over time.
Takeaway
When a Winner Becomes a Bigger Position
The question now is how much of that progress is already reflected in the share price.
Record earnings are encouraging, but they do not automatically make a stock attractively valued. Further gains are possible. So is a period when earnings and dividends need time to catch up with the price.
We do not need to predict the next move to manage that risk.
Instead, we assess valuation alongside position size. If a holding becomes expensive and grows beyond our portfolio guidelines, trimming may be appropriate, even when we remain confident in the company.
We can remain committed to a business while reducing the amount of capital we have exposed to it.
For Royal Bank and TD Bank, strong earnings results reinforce our confidence in the businesses. Our valuation measures help us assess whether today’s prices justify adding, holding, or trimming.
The goal is to keep a successful investment from becoming an outsized risk to the portfolio, while allowing our dividend income to continue growing.
DGI Scorecard
This Week’s Highlights
MP Wealth-Builder Model Portfolio (Canada)
Annualized Total Return: +17.19% since inception (May 1, 2022)
Total Return (includes dividends): +14.46 % year-to-date
Current Yield: 3.2%
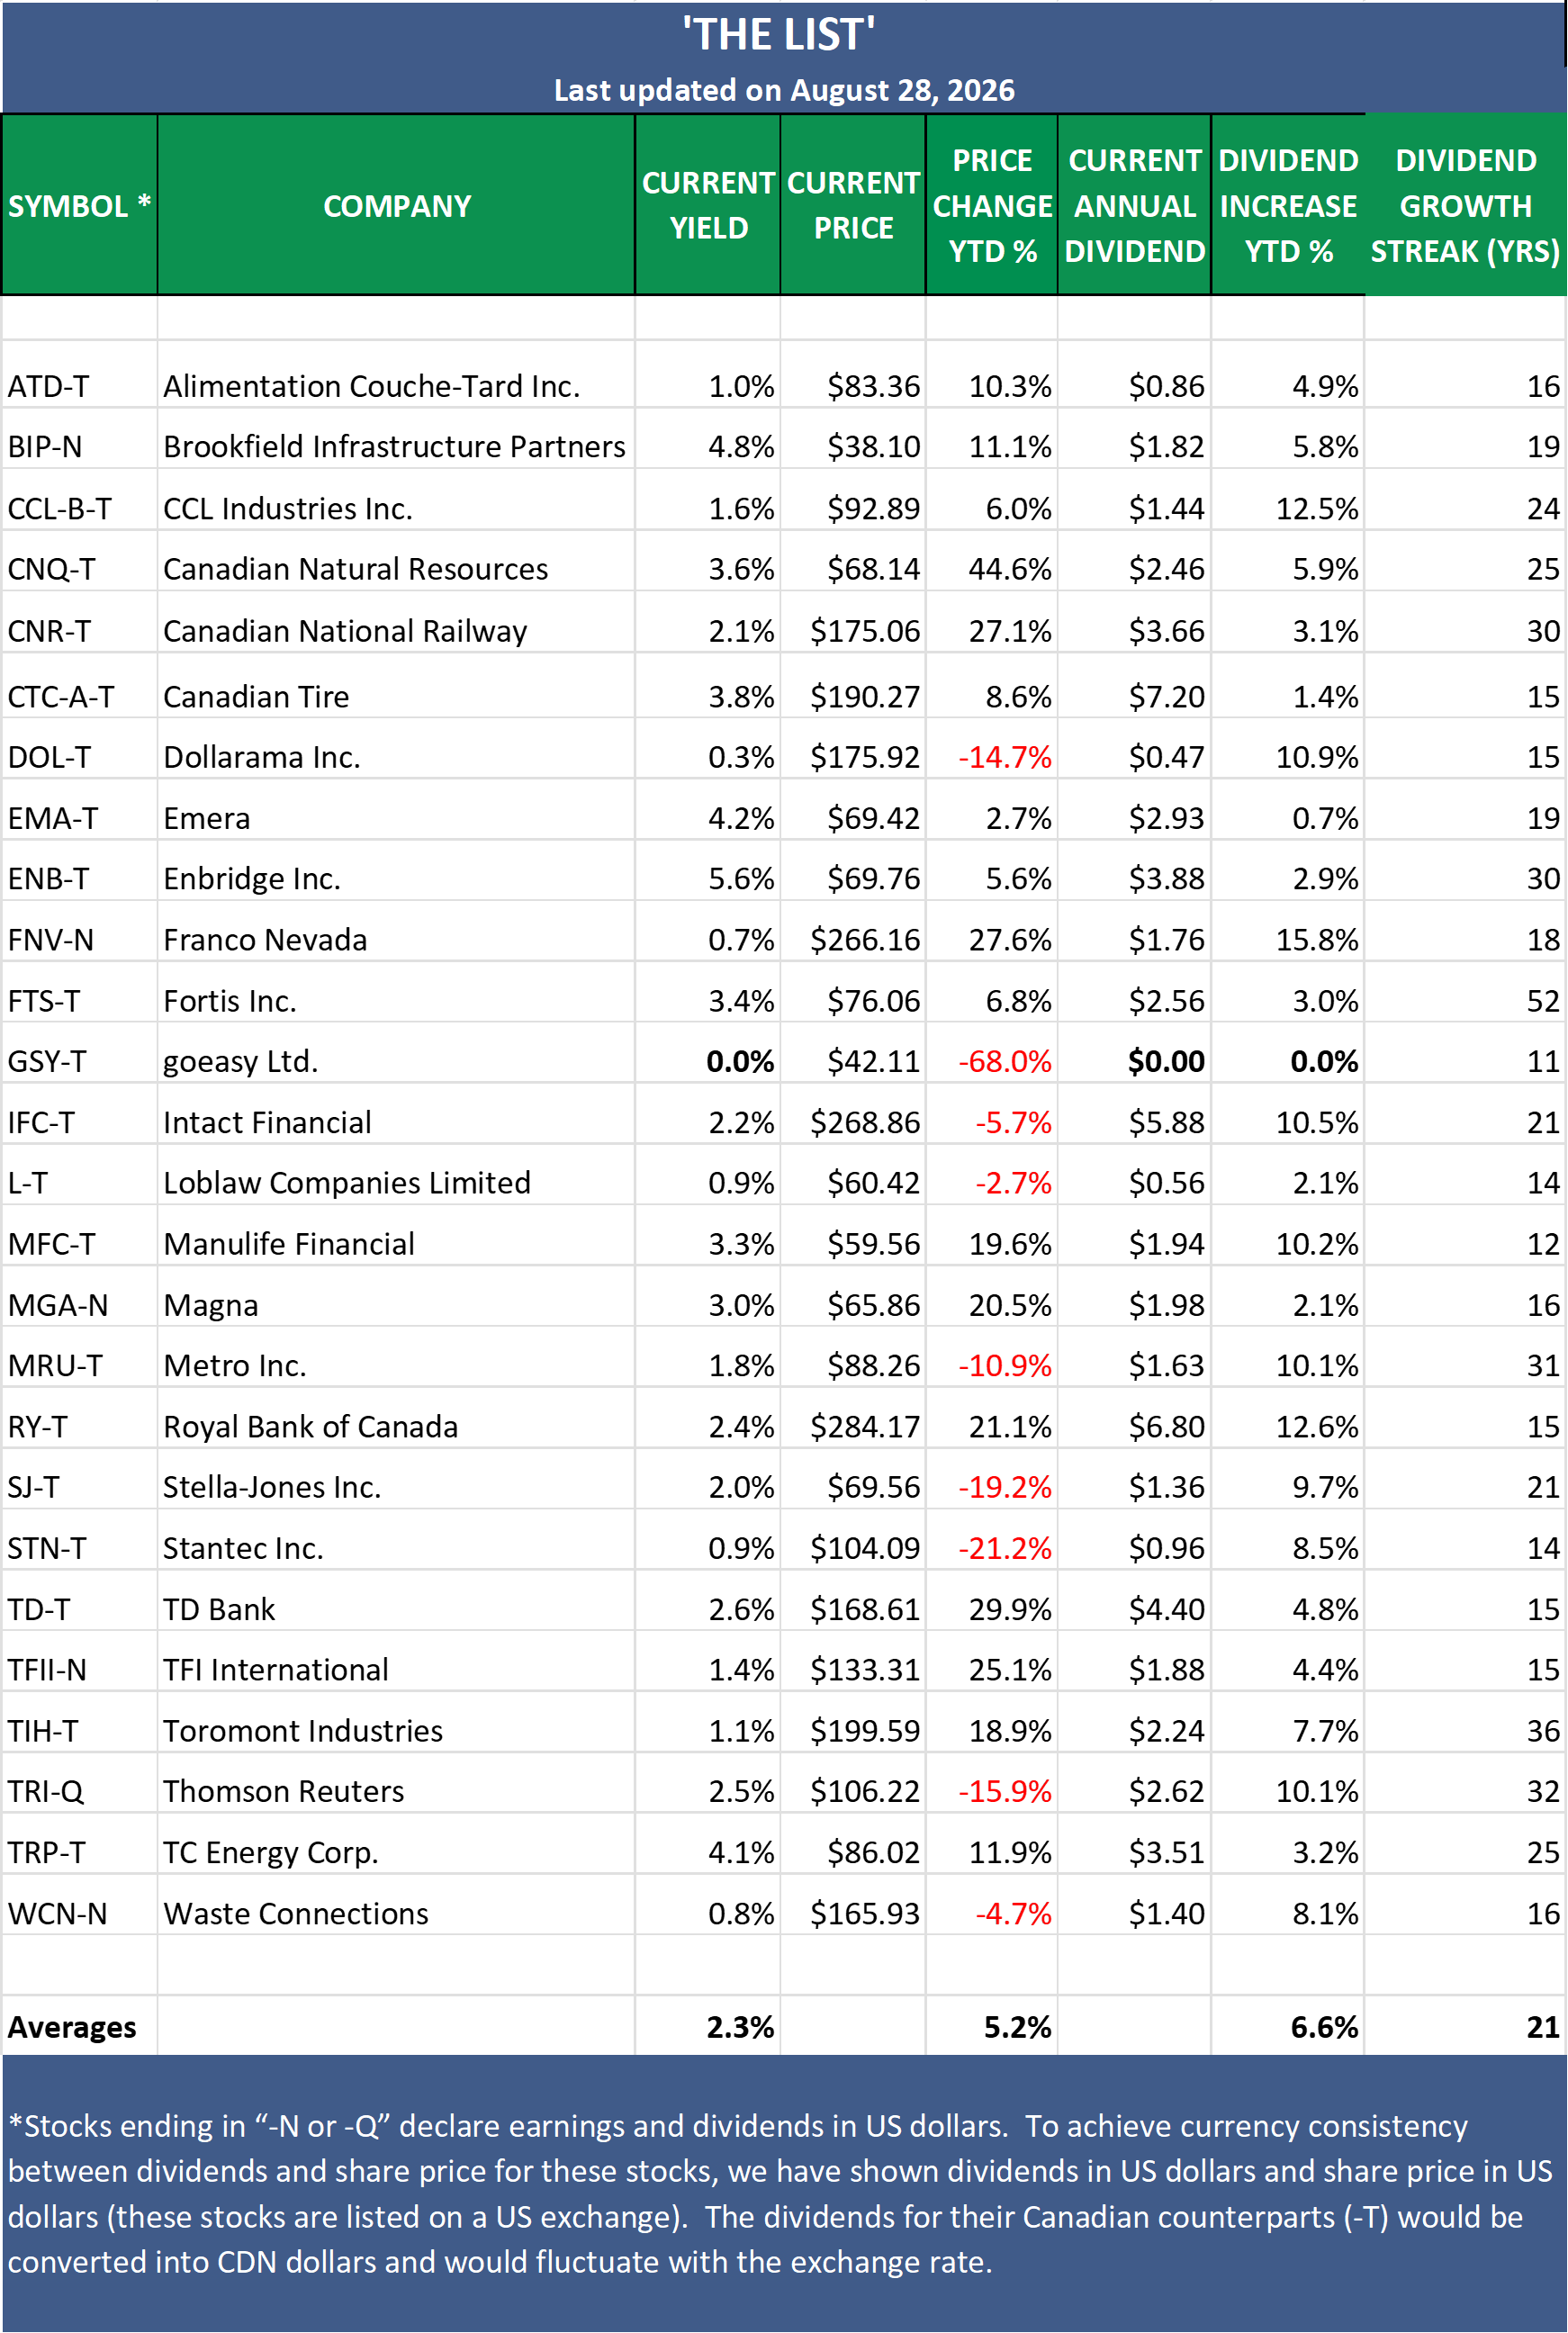
The List (Canada)
Dividend Income Growth: +6.6% year-to-date
Capital Appreciation: +5.2% year-to-date
Dividend Announcements Last Week: None
Earnings Reports Last Week: Two
Earnings Reports This Week: One
Top Performers Last Week:
TD Bank (TD-T), up +4.57%.
Stantec Inc. (STN-T), up +2.16%.
Manulife Financial (MFC-T), up +1.62%.
Worst Performer Last Week:
Magna (MGA-N), down -9.84%.
Watchlists
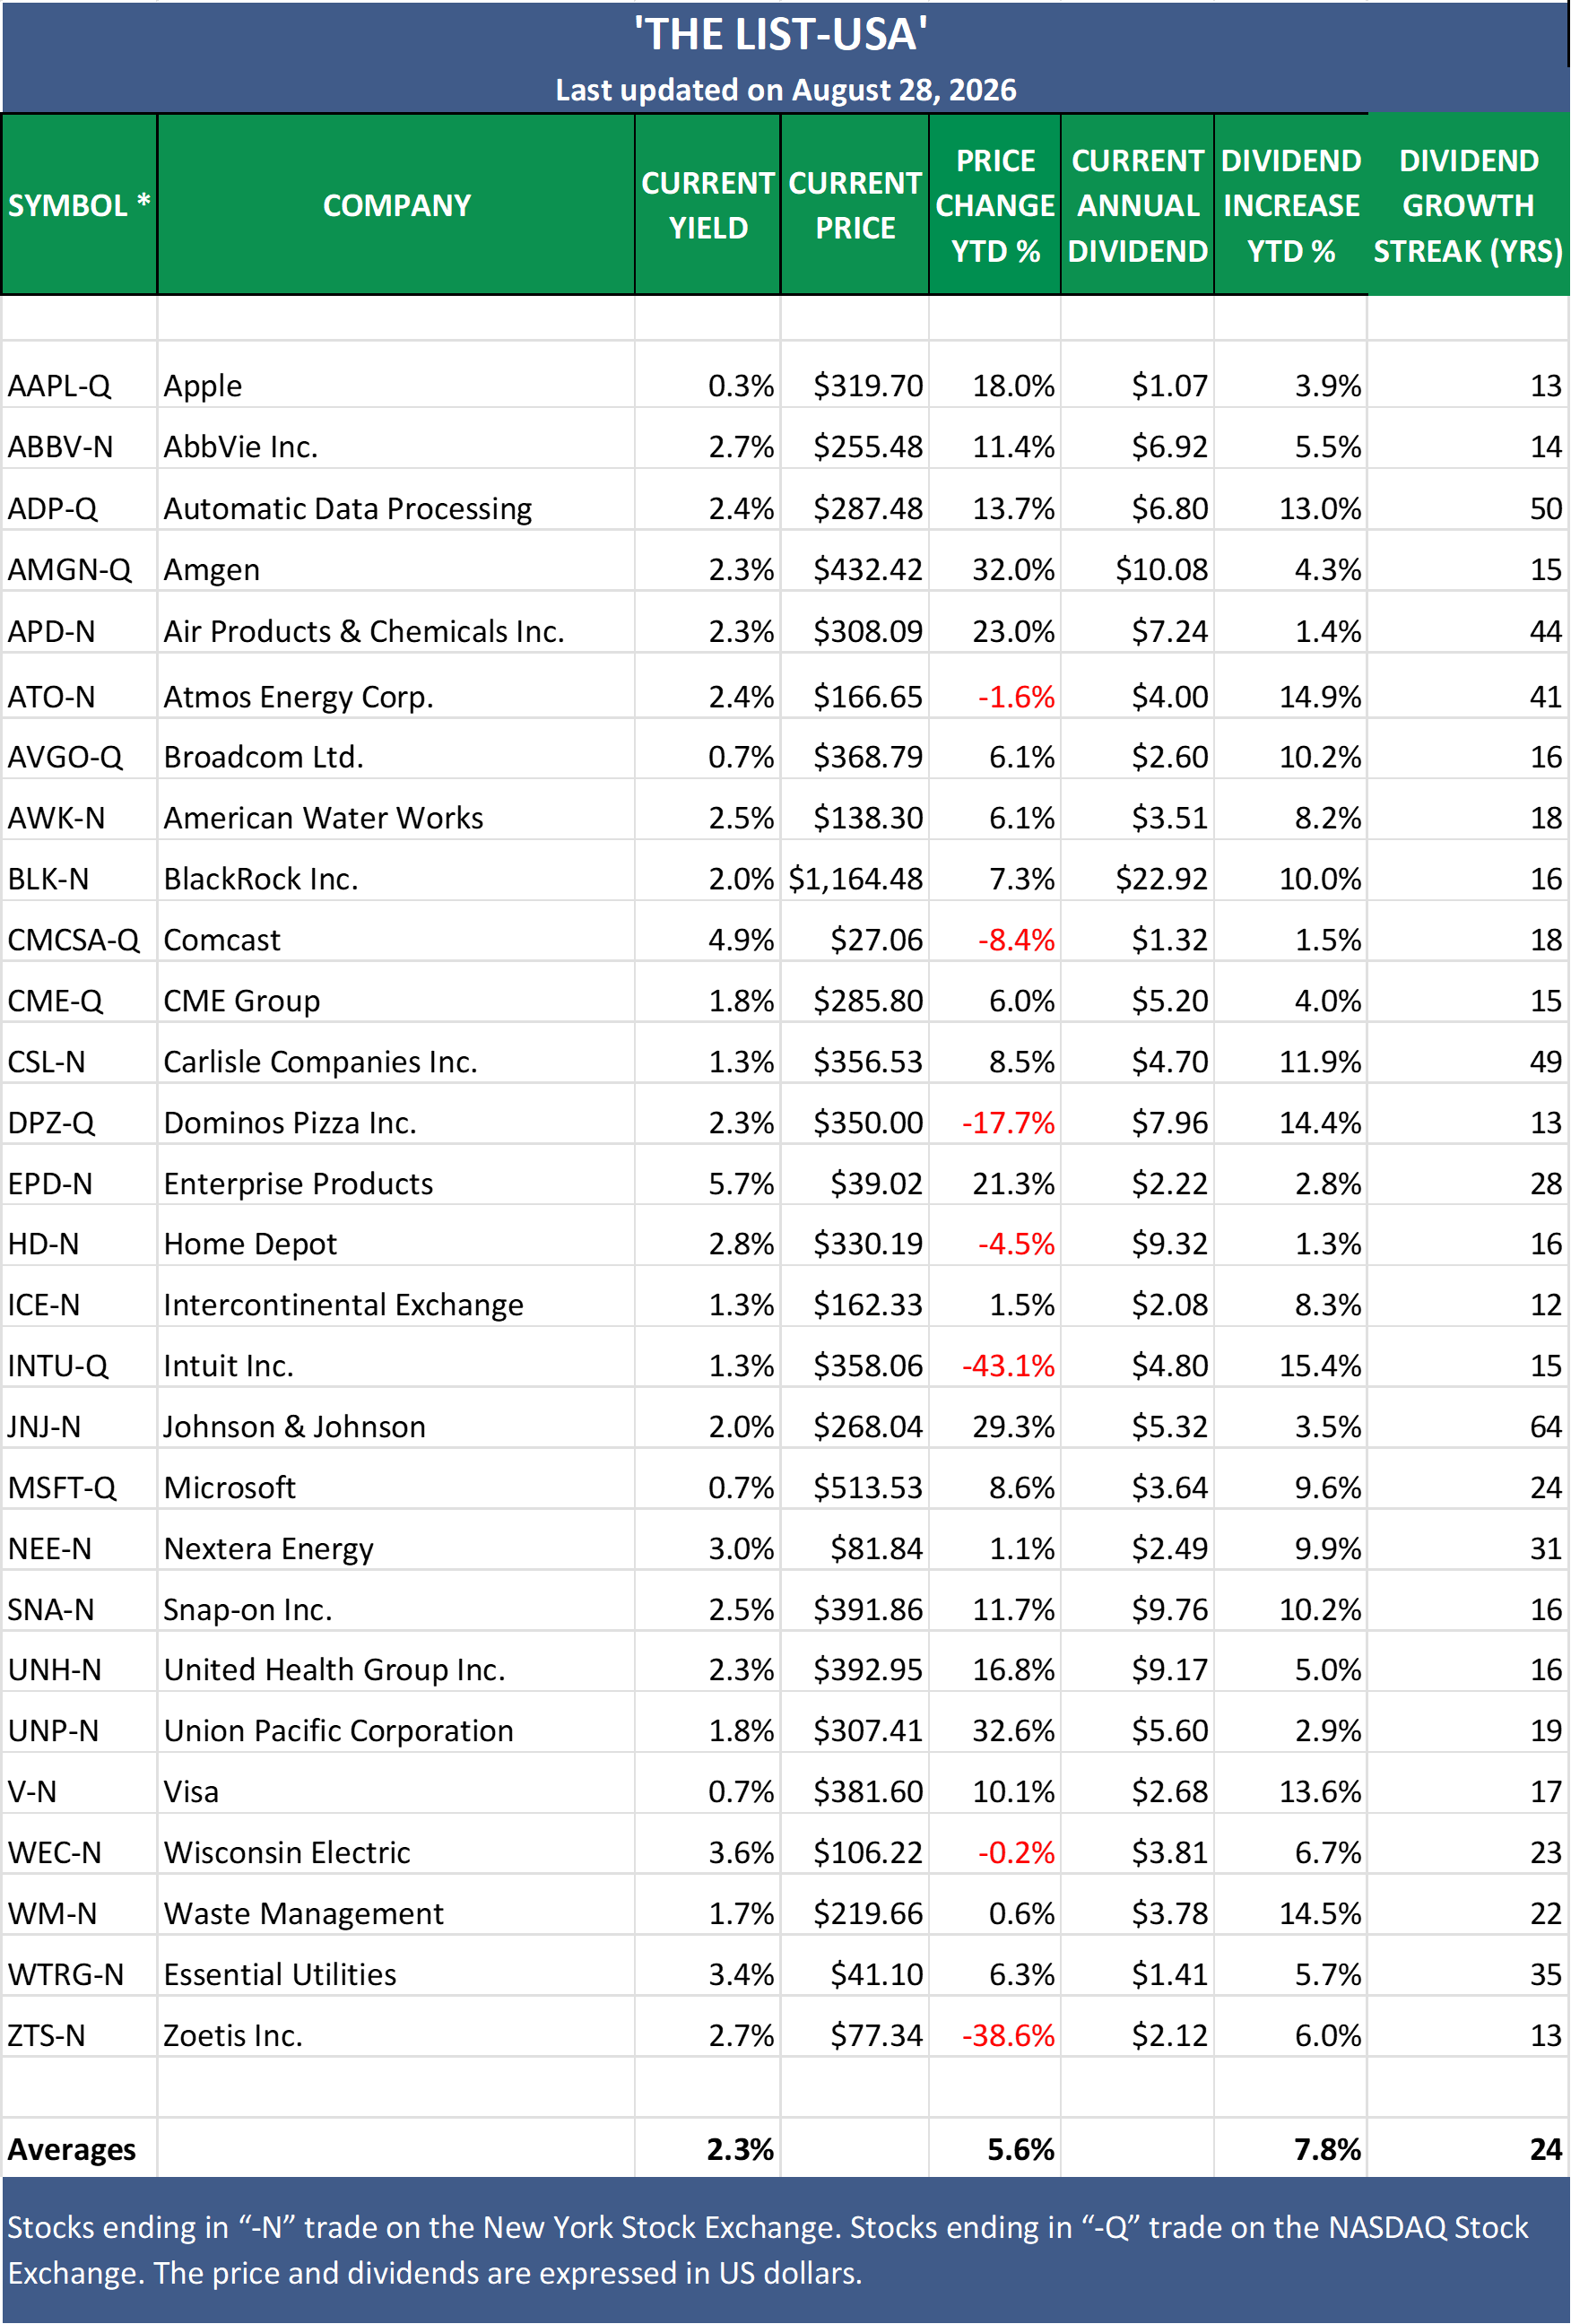
The Magic Pants 2026 list (The List) includes 26 Canadian dividend growth stocks, and our new American watchlist (The List-USA) contains 28 companies. Here are the criteria to be considered a candidate on our watchlists:
Dividend growth streak: 10 years or more.
Market cap: Minimum one billion dollars.
Diversification: Limit of five companies per sector, preferably two per industry.
Cyclicality: Exclude REITs and pure-play energy companies due to high cyclicality.
Based on these criteria, companies are added or removed from The List annually on January 1. Prices and dividends are updated weekly.
The watchlists are not a portfolio but a coaching tool that helps us think about ideas and manage risk in our model portfolio. We own some, but not all, of the companies on these watchlists. In other words, we might want to buy these companies when valuation looks attractive.
Our newsletter provides readers with a comprehensive insight into the implementation and advantages of our dividend growth investing strategy. This evidence-based, unbiased approach empowers DIY investors to outperform both actively managed dividend funds and passively managed indexes and dividend ETFs over longer-term horizons.
In the last week of every month, I will show the updated watchlist for our American dividend growers (The List-USA). The watchlist will be shown after the Canadian watchlist above.
New to Magic Pants?
Magic Pants Dividend Growth Investing is a behind-the-scenes look at how a dividend growth portfolio is built, maintained, and improved using real money, real positions, and real results.
Our objective is to grow dividend income by 7-10%+ annually while achieving long-term capital appreciation that matches or exceeds the broader market over a full investing cycle.
The name comes from a simple idea: when a quality company pays a dividend, cash moves from the company’s pocket to yours while your ownership stake remains intact. As earnings and dividends grow, the compounding cycle can accelerate. That’s the magic.
Build Your Own Growing Income Machine
Looking for a helping hand in the market? Members of Magic Pants Dividend Growth Investing receive exclusive ideas and guidance designed to help navigate changing market conditions.
The Magic Pants model portfolios (Canadian and American) are real-money, dividend-growth portfolios funded with actual capital and executed in live accounts. Every position shown is owned, sized, and tracked in real time using our disciplined DGI process.
Become a paid subscriber and see exactly how we put the process into practice. You’ll also receive full access to this post and exclusive subscriber-only content.
We do the work. You stay in control.
From breaking news and quarterly earnings to the latest dividend announcements, we highlight what matters most and explain what it means for dividend growth investors.
