

How to Turn a Good DGI Watchlist Into A Great DGI Portfolio
MP Market Review - October 3, 2025

Summary
Welcome to this week’s MP Market Review – your go-to source for insights and updates on the Canadian dividend growth companies we track on The List! While we’ve expanded our watchlists to include U.S. companies, The List-USA, our Canadian lineup remains the cornerstone of our coaching approach.
Don’t miss out on exclusive newsletters and premium content that will help you sharpen your investing strategy. Explore it all at magicpants.substack.com.
Your journey to dividend growth mastery starts here – let’s dive in!
Last week, dividend growth of The List stayed the same with an average return of +6.9% YTD (income).
Last week, the price of The List was up from the previous week with an average return of +11.9% YTD (capital).
Last week, there were no dividend announcements from companies on The List.
Last week, there were no earnings reports from companies on The List.
This week, no companies from The List will report on earnings.
DGI Clipboard
“Success in investing has two parts: finding edge and fully taking advantage of it through proper position sizing.
- Michael J. Mauboussin
How to Turn a Good DGI Watchlist Into A Great DGI Portfolio
Intro
YTD Performance: The List +11.9% | Model Portfolio (CDN) +20.0%
Each January, we assemble a curated watchlist of Canadian and American dividend growth companies that we monitor throughout the year. These lists help coach our process, guide new investments, and serve as the foundation for our model portfolios.
We rarely invest outside these lists, but how we weight our investments once they enter the portfolio is what creates our edge.
The List: A Quality Benchmark
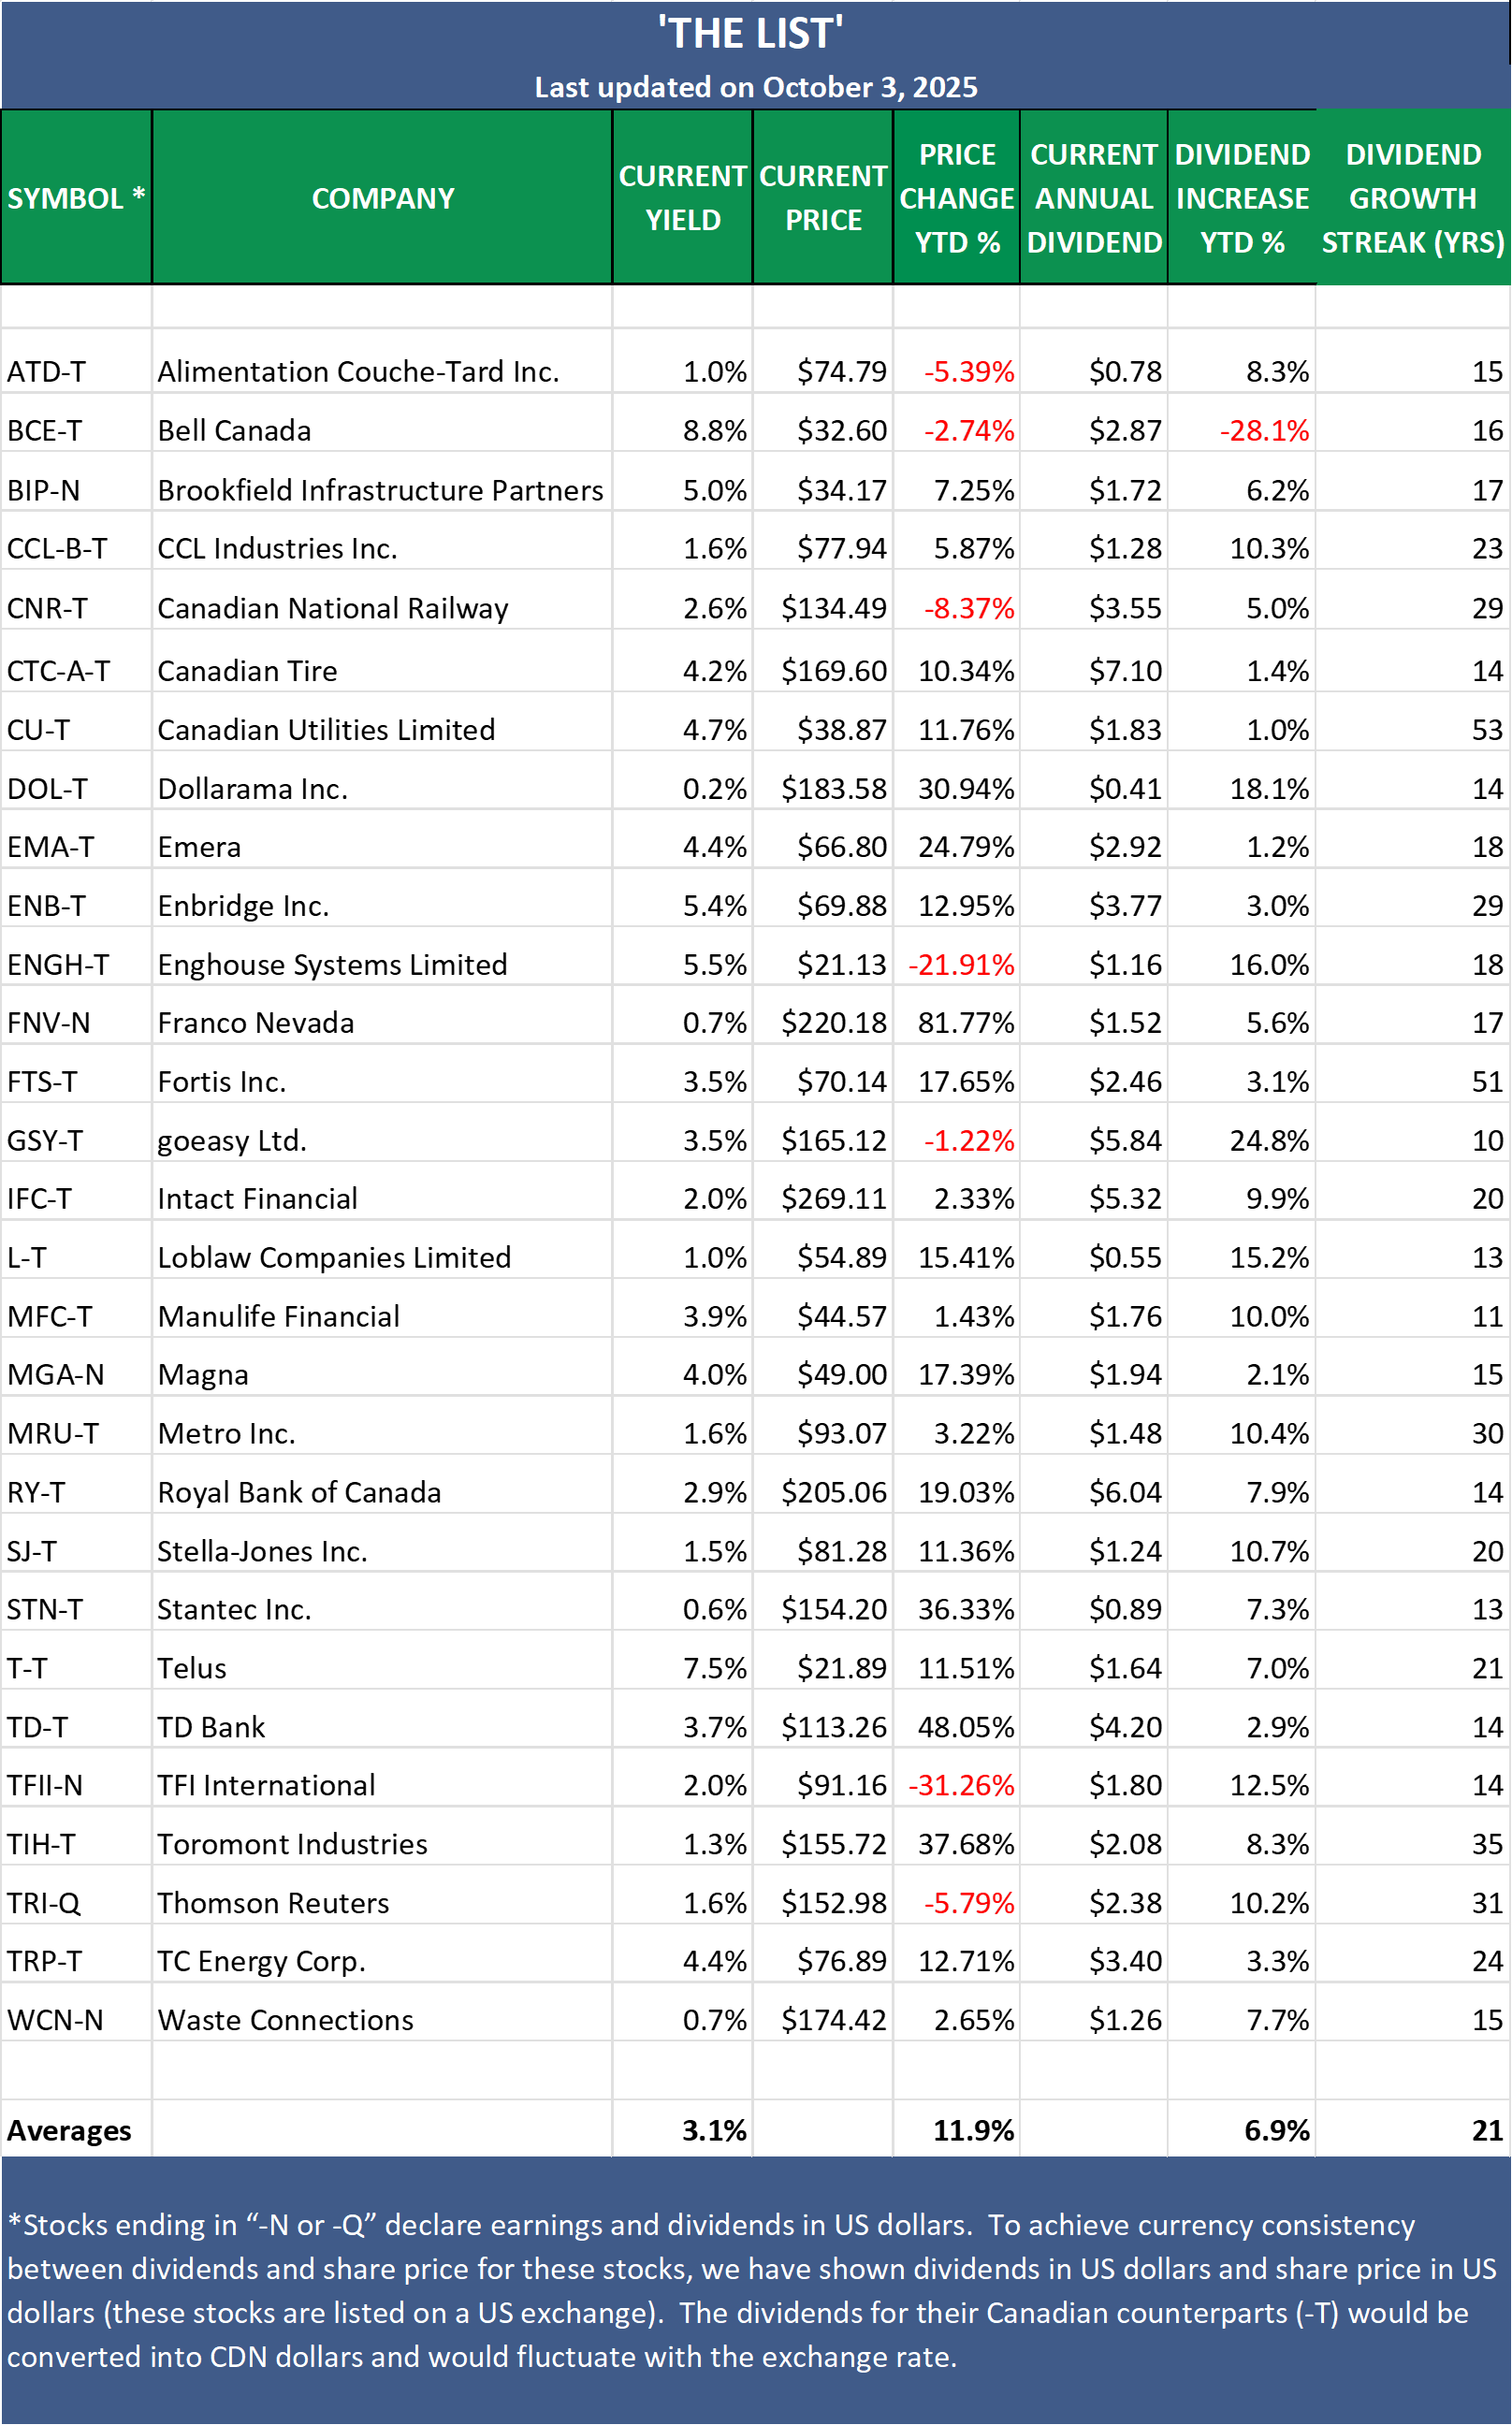
Think of The List as an equal-weighted exchange-traded fund (ETF) made up of Canada’s best dividend growth companies. The performance you see, like this year’s +11.9% gain, assumes equal investment in every stock on January 1.
That is impressive on its own, but our Wealth-Builder Model Portfolio (CDN) has delivered nearly double the return.
The Secret: Position Sizing with Purpose
Before any company from the watchlist earns a place in our model portfolio, it must pass two final hurdles:
Quality – look for only the best of the best when you invest. Stocks must possess as many of our quality indicators as possible.
Valuation – look to buy a quality company that is sensibly priced based on historical fundamentals and valuation metrics.
Once in the portfolio, we apply a position sizing framework. Core holdings, our highest-quality companies, receive larger allocations. Non-core holdings take smaller weights.
This disciplined approach tilts the odds in our favour and amplifies the performance of our best ideas.
As an example: Had we weighted each company equally, our return of our model portfolio this year would have almost mirrored The List at +12.1%. By sizing positions in line with our current portfolio position sizes, the Wealth-Builder Model Portfolio (CDN) would stand at +20.0% YTD.
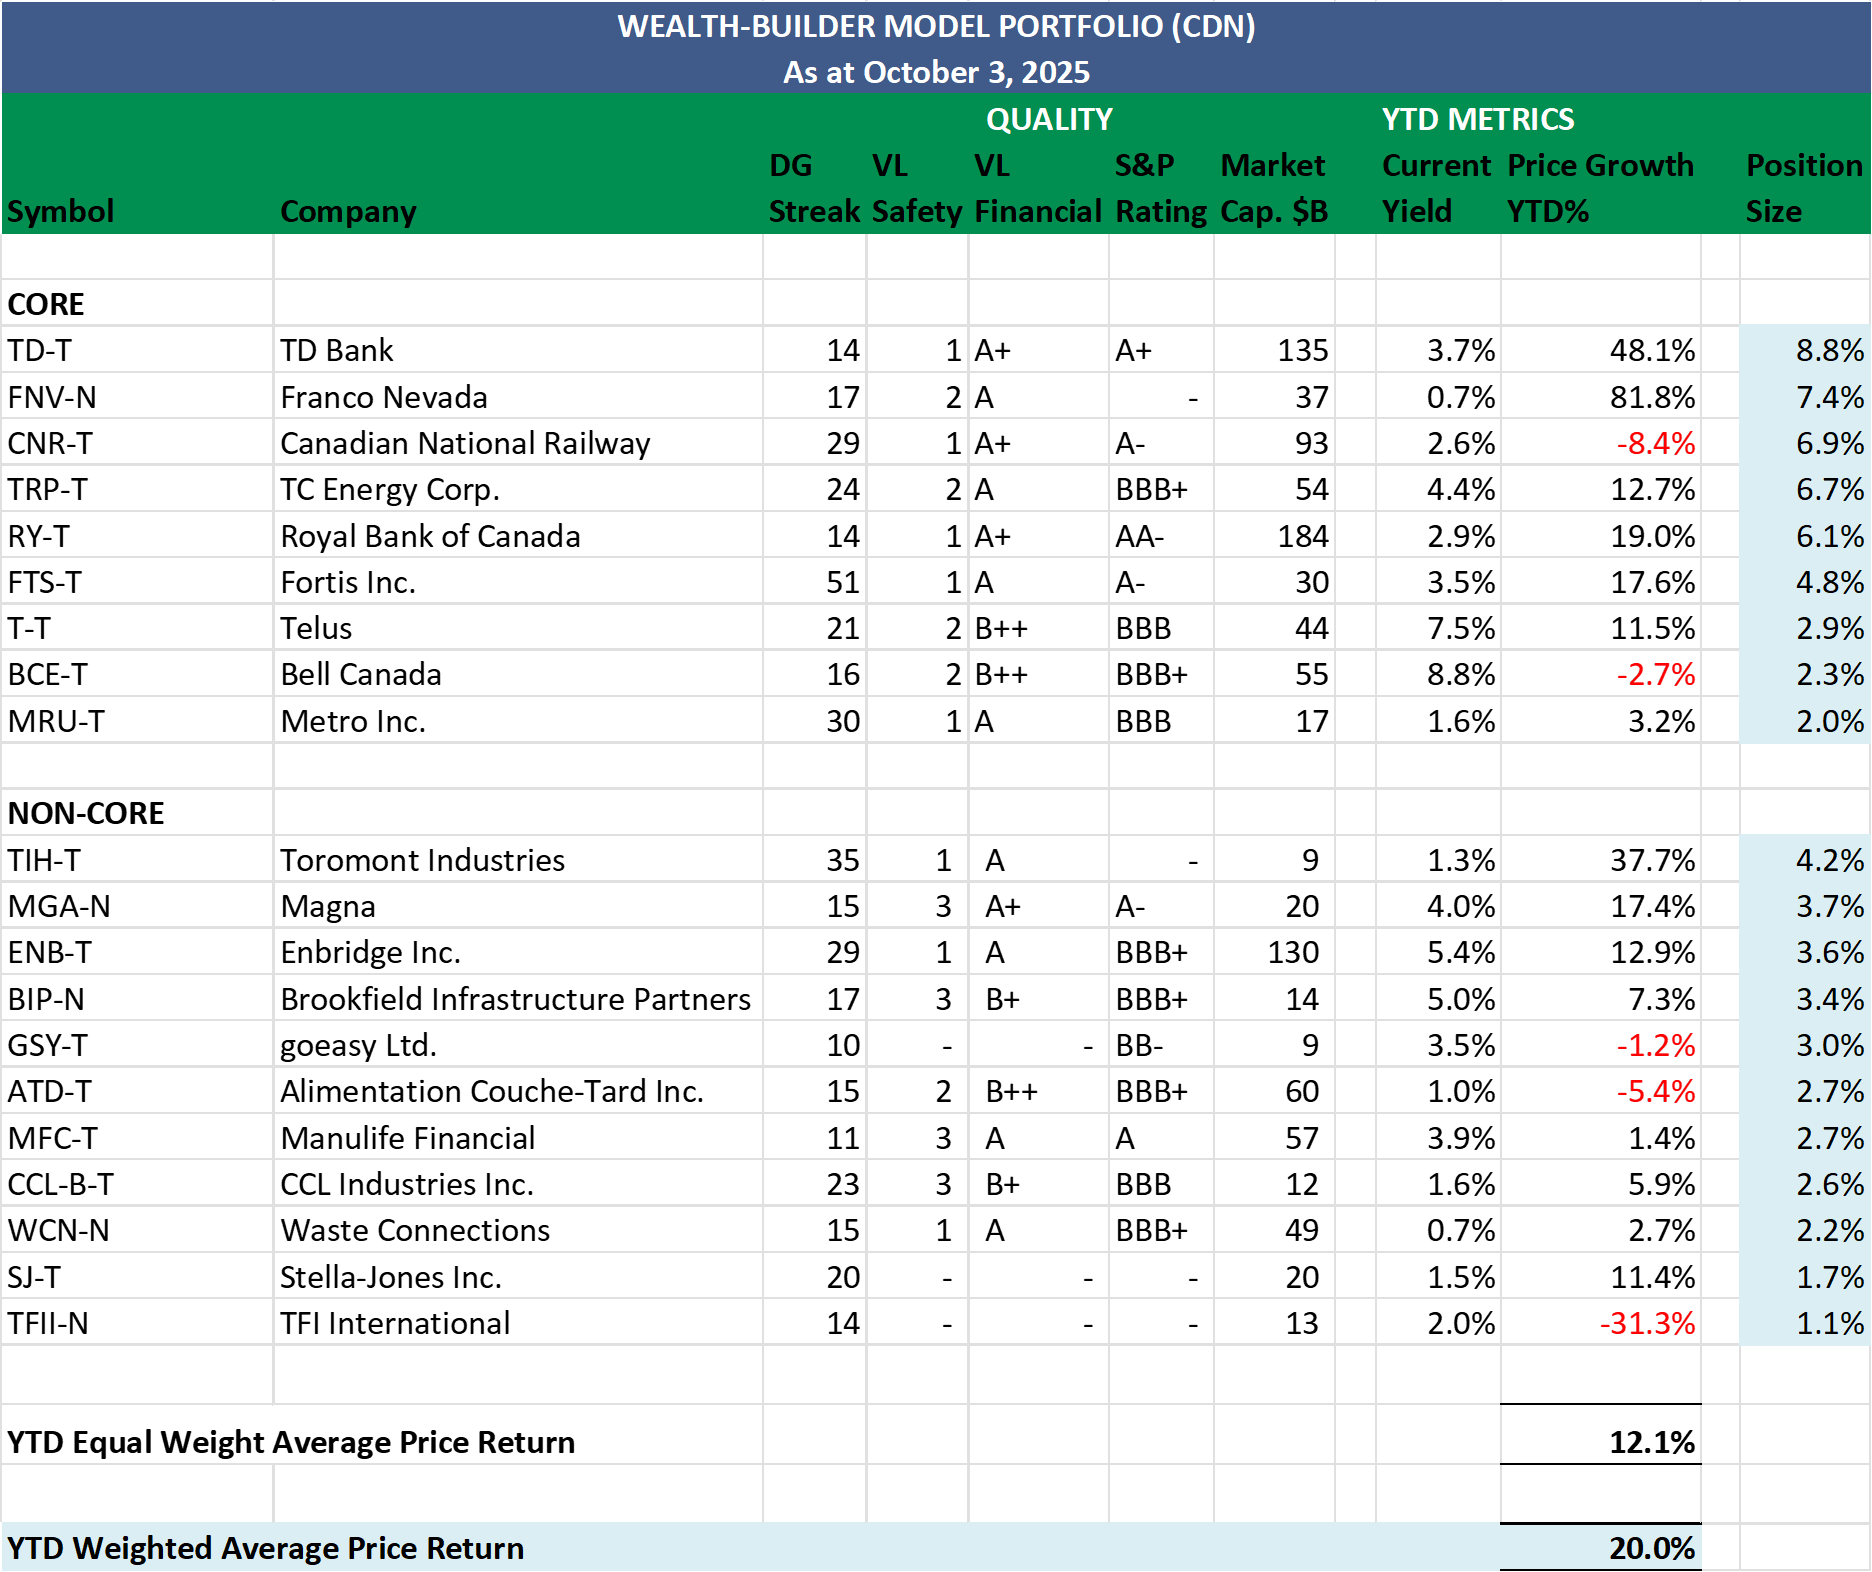
Source: Magic Pants Wealth-Builder Model Portfolio (CDN) as of October 3, 2025
Why It Matters
Position sizing is the quiet advantage few investors talk about. It magnifies the contribution of your best businesses while minimizing the drag from the rest. Over time, this simple principle compounds into a meaningful performance gap.
Takeaway
Our watchlists are a valuable resource for anyone looking to build or refine a dividend growth investing (DGI) portfolio. They provide a strong foundation of quality, but the real edge comes from disciplined position sizing and valuation-based buying.
Understanding the process is one thing; executing it is another. For investors who want to follow along, receive real-time updates, and access our full model portfolio strategy, become a paid subscriber and see how our edge compounds over time.
Become a paid partner, and I’ll show you exactly how I do it. With real money. In real stocks. In addition, gain full access to this post and exclusive, subscriber-only content. We do the work; you stay in control. Subscribe today and take your dividend growth investing to the next level!
DGI Scorecard
The List (2025)
The Magic Pants 2025 list includes 29 Canadian dividend growth stocks. Here are the criteria to be considered a candidate on The List:
Dividend growth streak: 10 years or more.
Market cap: Minimum one billion dollars.
Diversification: Limit of five companies per sector, preferably two per industry.
Cyclicality: Exclude REITs and pure-play energy companies due to high cyclicality.
Based on these criteria, companies are added or removed from The List annually on January 1. Prices and dividends are updated weekly.
The List is not a portfolio but a coaching tool that helps us think about ideas and risk manage our model portfolio. We own some but not all the companies on The List. In other words, we might want to buy these companies when valuation looks attractive.
Our newsletter provides readers with a comprehensive insight into the implementation and advantages of our dividend growth investing strategy. This evidence-based, unbiased approach empowers DIY investors to outperform both actively managed dividend funds and passively managed indexes and dividend ETFs over longer-term horizons.
Note: In the last week of every month, I will show the updated watchlist for our American dividend growers, The List-USA. It will be shown after the Canadian watchlist below.
Performance of 'The List'
Last week, dividend growth stayed the same, with an average return of +6.9% YTD (income).
The price of ‘The List’ was up from the previous week, with an average YTD return of +11.9% (capital).
Even though prices may fluctuate, the dependable growth in our income does not. Stay the course. You will be happy you did.
Last week’s best performers on ‘The List’ were Stella-Jones Inc. (SJ-T), up +6.18%.; Magna (MGA-N), up +5.11%; and Stantec Inc. (STN-T) up +4.22%.
goeasy Ltd. (GSY-T) was the worst performer last week, down -5.11%.
From breaking news to quarterly earnings reports, we break down the week’s biggest headlines to help you make sense of the market. The full newsletter has even more insights and analysis, don’t miss out!
