

Looking back at the 10 Year returns of ‘The List’ and how we predict future returns
MP Market Review - January 12, 2024
Summary
This is a weekly installment of our MP Market Review series, which provides updates on the financial markets and Canadian dividend growth companies we monitor on 'The List'.
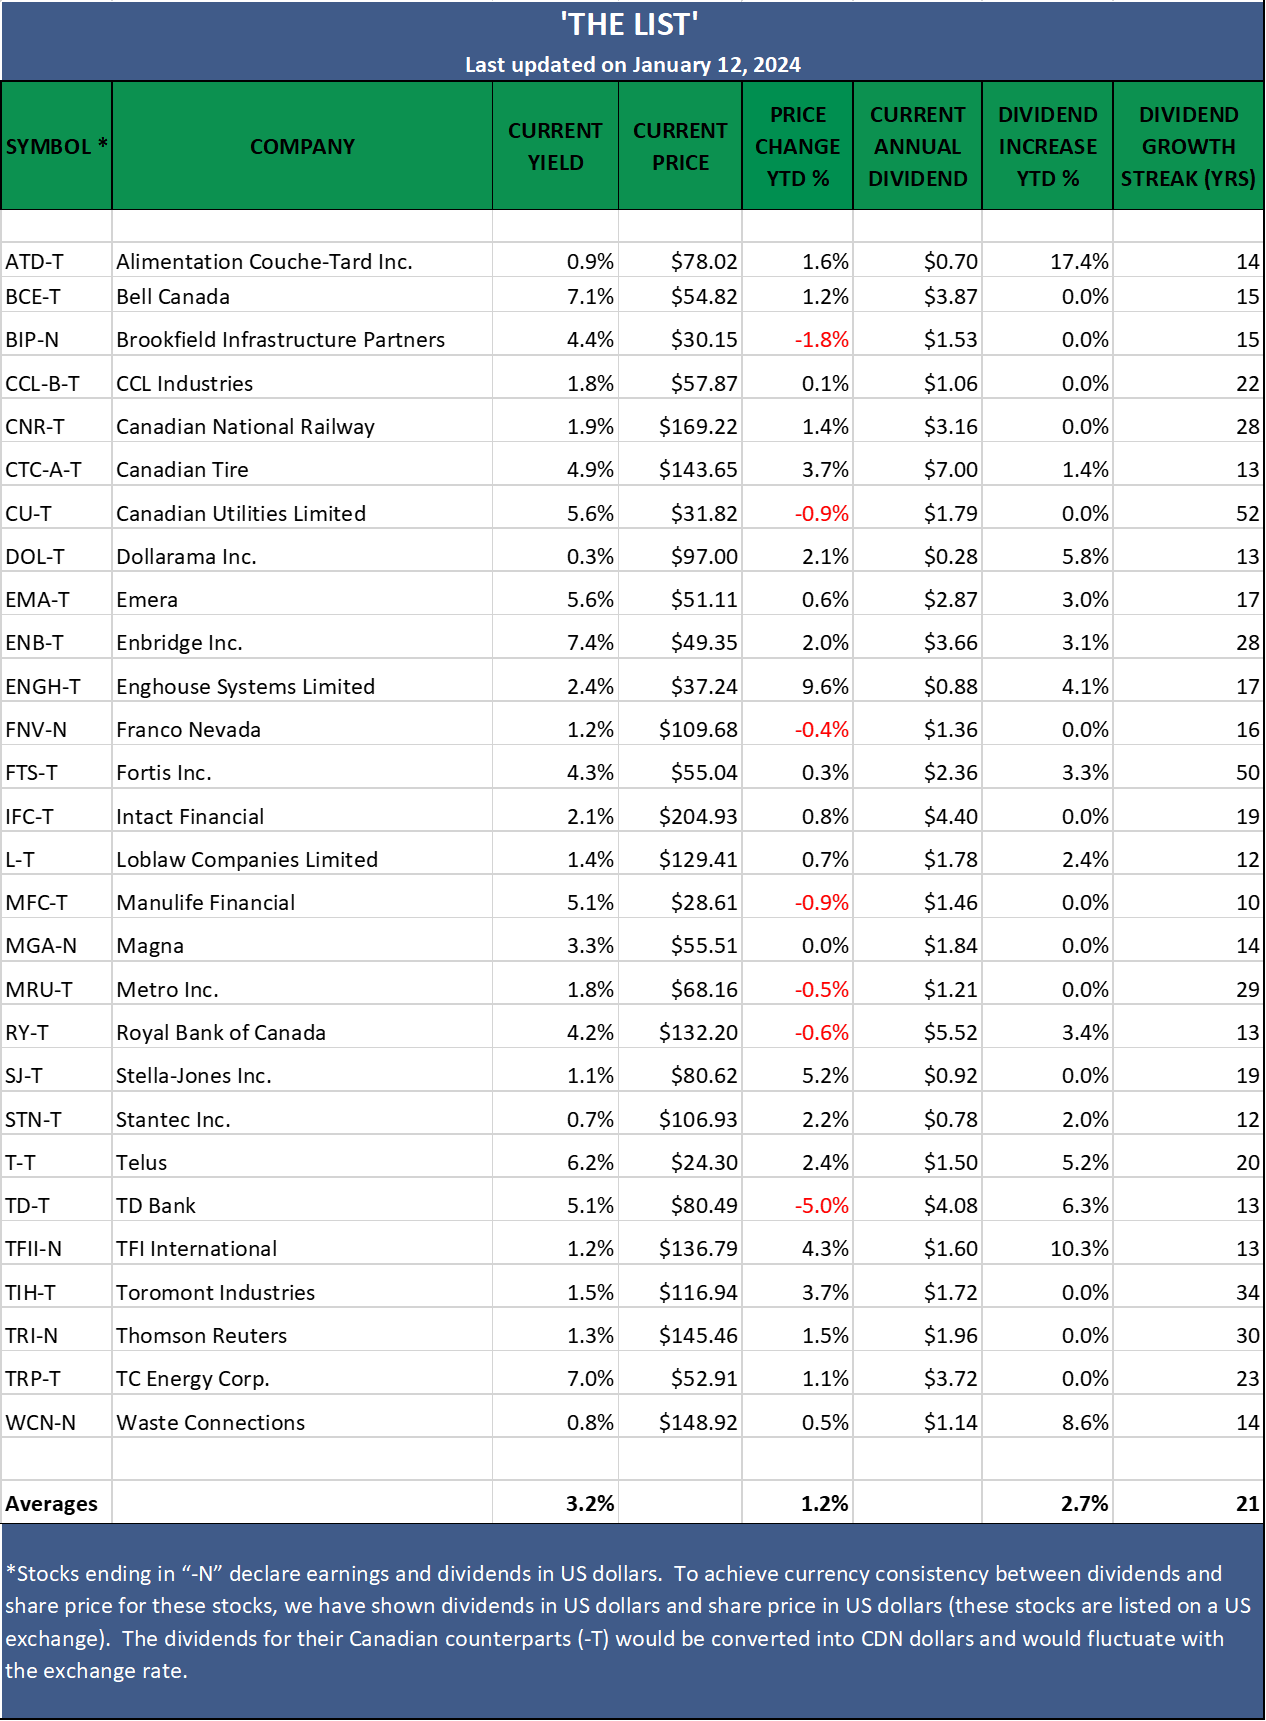
Last week, 'The List' was up with a YTD price return of +1.2% (capital). Dividends have increased by +2.7% YTD, highlighting the growth in the dividend (income).
Last week, there were no dividend announcements from companies on 'The List'.
Last week, there were no earnings reports from companies on 'The List'.
No companies on 'The List' are due to report earnings this week.
DGI Scoreboard
The List (2024)
The Magic Pants 2024 list includes 28 Canadian dividend growth stocks. Here are the criteria to be considered a candidate on ‘The List’:
Dividend growth streak: 10 years or more.
Market cap: Minimum one billion dollars.
Diversification: Limit of five companies per sector, preferably two per industry.
Cyclicality: Exclude REITs and pure-play energy companies due to high cyclicality.
Based on these criteria, companies on ‘The List’ are added or removed annually on January 1. Prices and dividends are updated weekly.
While ‘The List’ does not function as a portfolio on its own, it serves as an excellent initial reference for individuals looking to diversify their investments and achieve higher returns in the Canadian stock market. Through our newsletter, readers gain a deeper understanding of how to implement and benefit from our Canadian dividend growth investing strategy.
For those interested in something more, please upgrade to a paid subscriber; you get the enhanced weekly newsletter, access to premium content, full privileges on the new Substack website (magicpants.substack.com), and DGI alerts whenever we make stock transactions in our portfolio.
Performance of 'The List'
Last week, 'The List' was up with a price return of +1.2% (capital). Dividend growth is looking as dependable as always. Some dividends show a YTD increase due to announcements during last year, which carry over into this calendar year. Dividends have increased by +2.7% YTD, highlighting the growth in the dividend (income).
The best performers last week on 'The List' were Enghouse Systems Limited (ENGH-T), up +6.3%; Stella-Jones Inc. (SJ-T), up +5.6%; and TFI International (TFII-N), up +3.9%.
TD Bank (TD-T) was the worst performer last week, down -6.9%.
DGI Clipboard
“The dividend is such an important factor in the success of many stocks, that you could hardly go wrong by making an entire portfolio of companies that have raised their dividends for ten or 20 years in a row.”
- Peter Lynch, page 49, Beating the Street, 1993.
As the dividend grows, so does the price!
Notice the year-over-year dividend increases in the spreadsheet below. Most investors often overlook the impact of these expanding dividends. The increasing cash flow not only signifies wealth but also enhances the value of the company's stock, leading to capital growth.
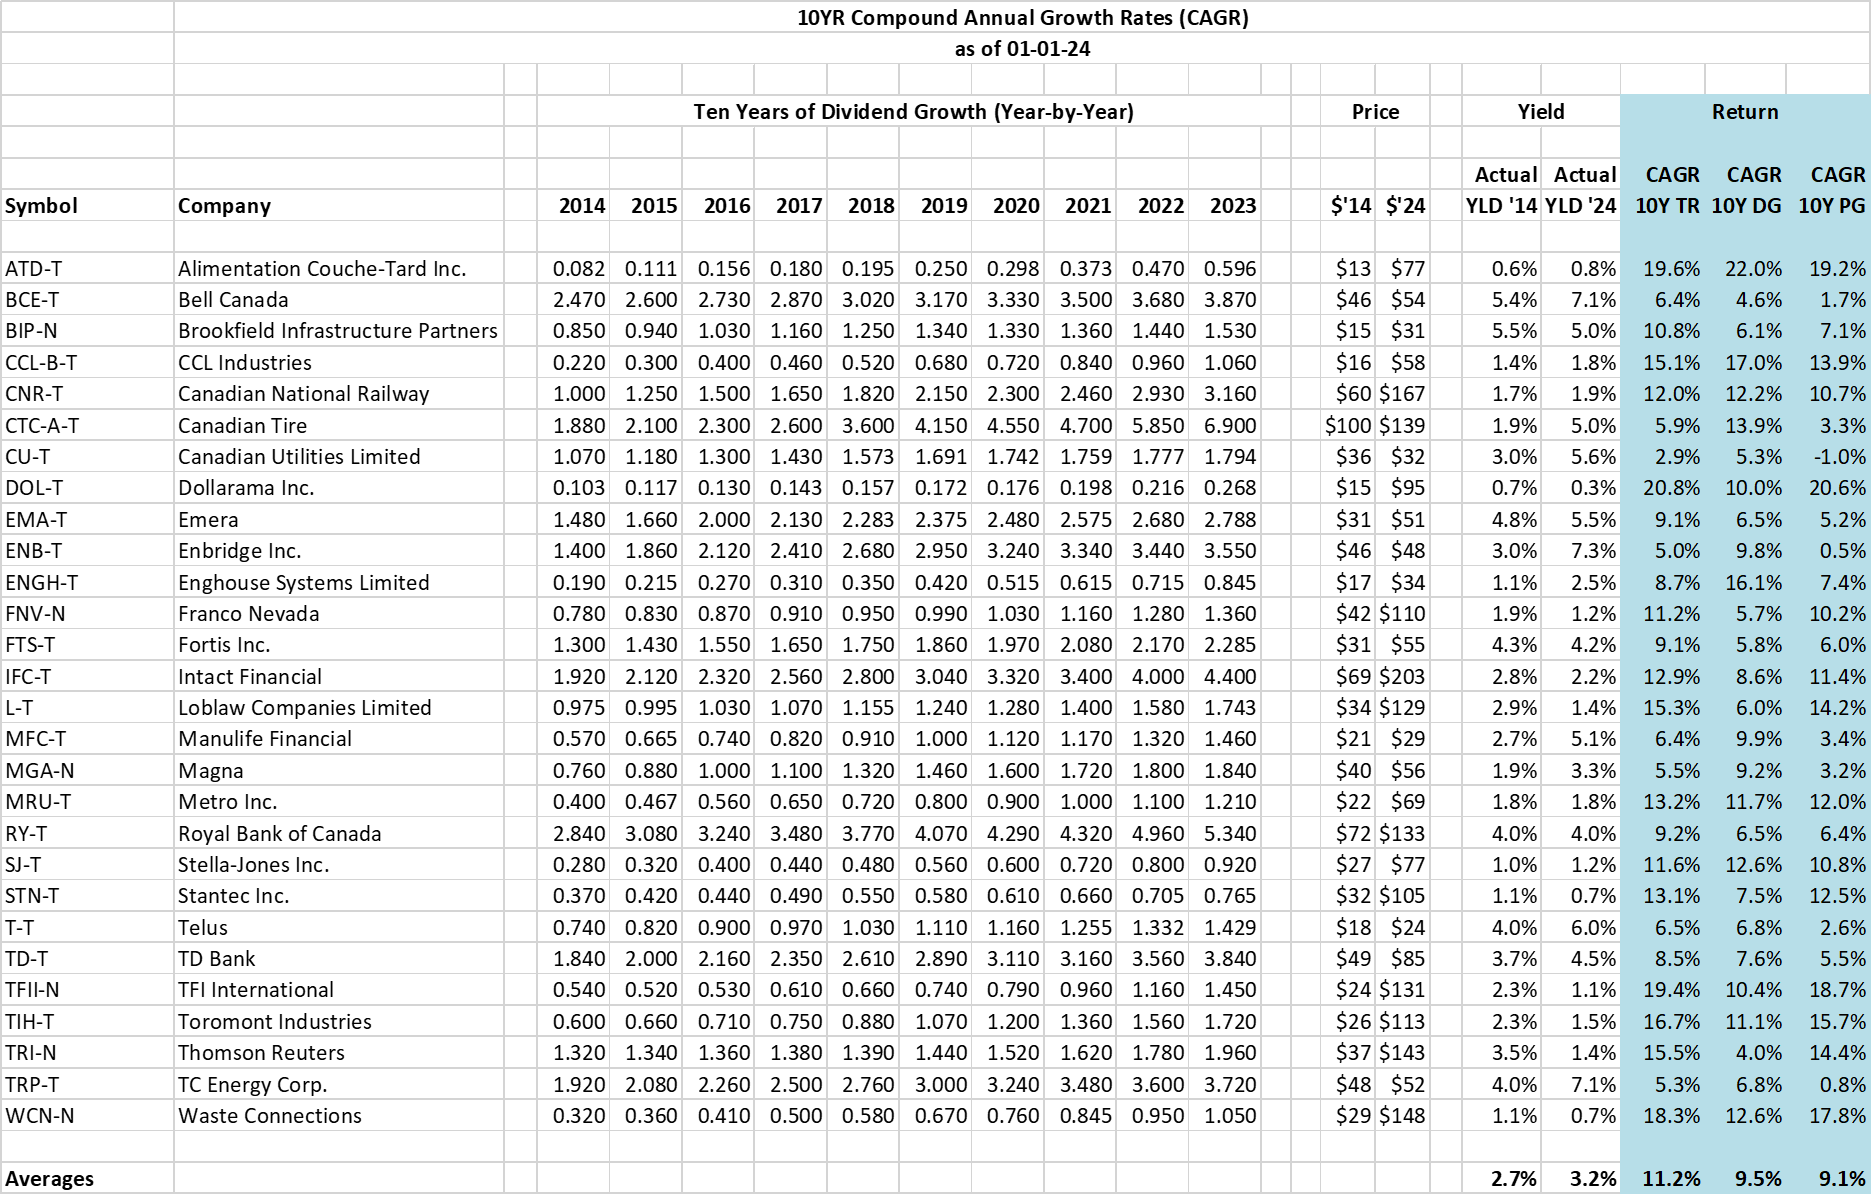
The shaded area displays three compound annual growth rates (CAGR) columns representing the annualized total return (TR), dividend growth (DG), and price growth (PG) over the past decade for companies on 'The List.' The overall list averages are presented at the bottom. If an equal amount of each company on 'The List' was purchased at the close of business on the first trading day of 2014, the returns shown in the 'Averages' row would have been generated by the close of business on the first trading day of 2024.
Here are two ways dividends and their growth can be used to predict returns:
Price growth tracks dividend growth. Dividend growth closely mirrors price growth, which is evident in the comparable averages of dividend growth (DG) and price growth (PG) at 9.5% and 9.1%, respectively. Company-stated or historically derived dividend growth rates, readily available, help us estimate future price growth.
Total return tracks starting yield + dividend growth over the decade. For 'The List,' our annualized total return (11.2%) closely matches the sum of the initial starting yield in 2014 and the annualized dividend growth rate. The slight difference can be attributed to valuation at the time of purchase.
Accurately predicting stock price growth and total return by focusing on the dividend and its growth eliminates the need to be concerned about short-term market fluctuations. John Bogle's view that "the stock market is a distraction to the business of investing" resonates with dividend growth investors.
This week, we explore another acquisition made by a company on 'The List' and how it plans to use AI to become more profitable. We then highlight some insightful articles on inflation and its implications for investors. Sitting on cash has never made much sense to us, but the effects are even worse when inflation is high…
