

MP Market Review - December 08, 2023
Posted by BM on December 11, 2023
Summary
This is a weekly installment of our MP Market Review series, which provides updates on the financial markets and Canadian dividend growth companies we monitor on 'The List'.
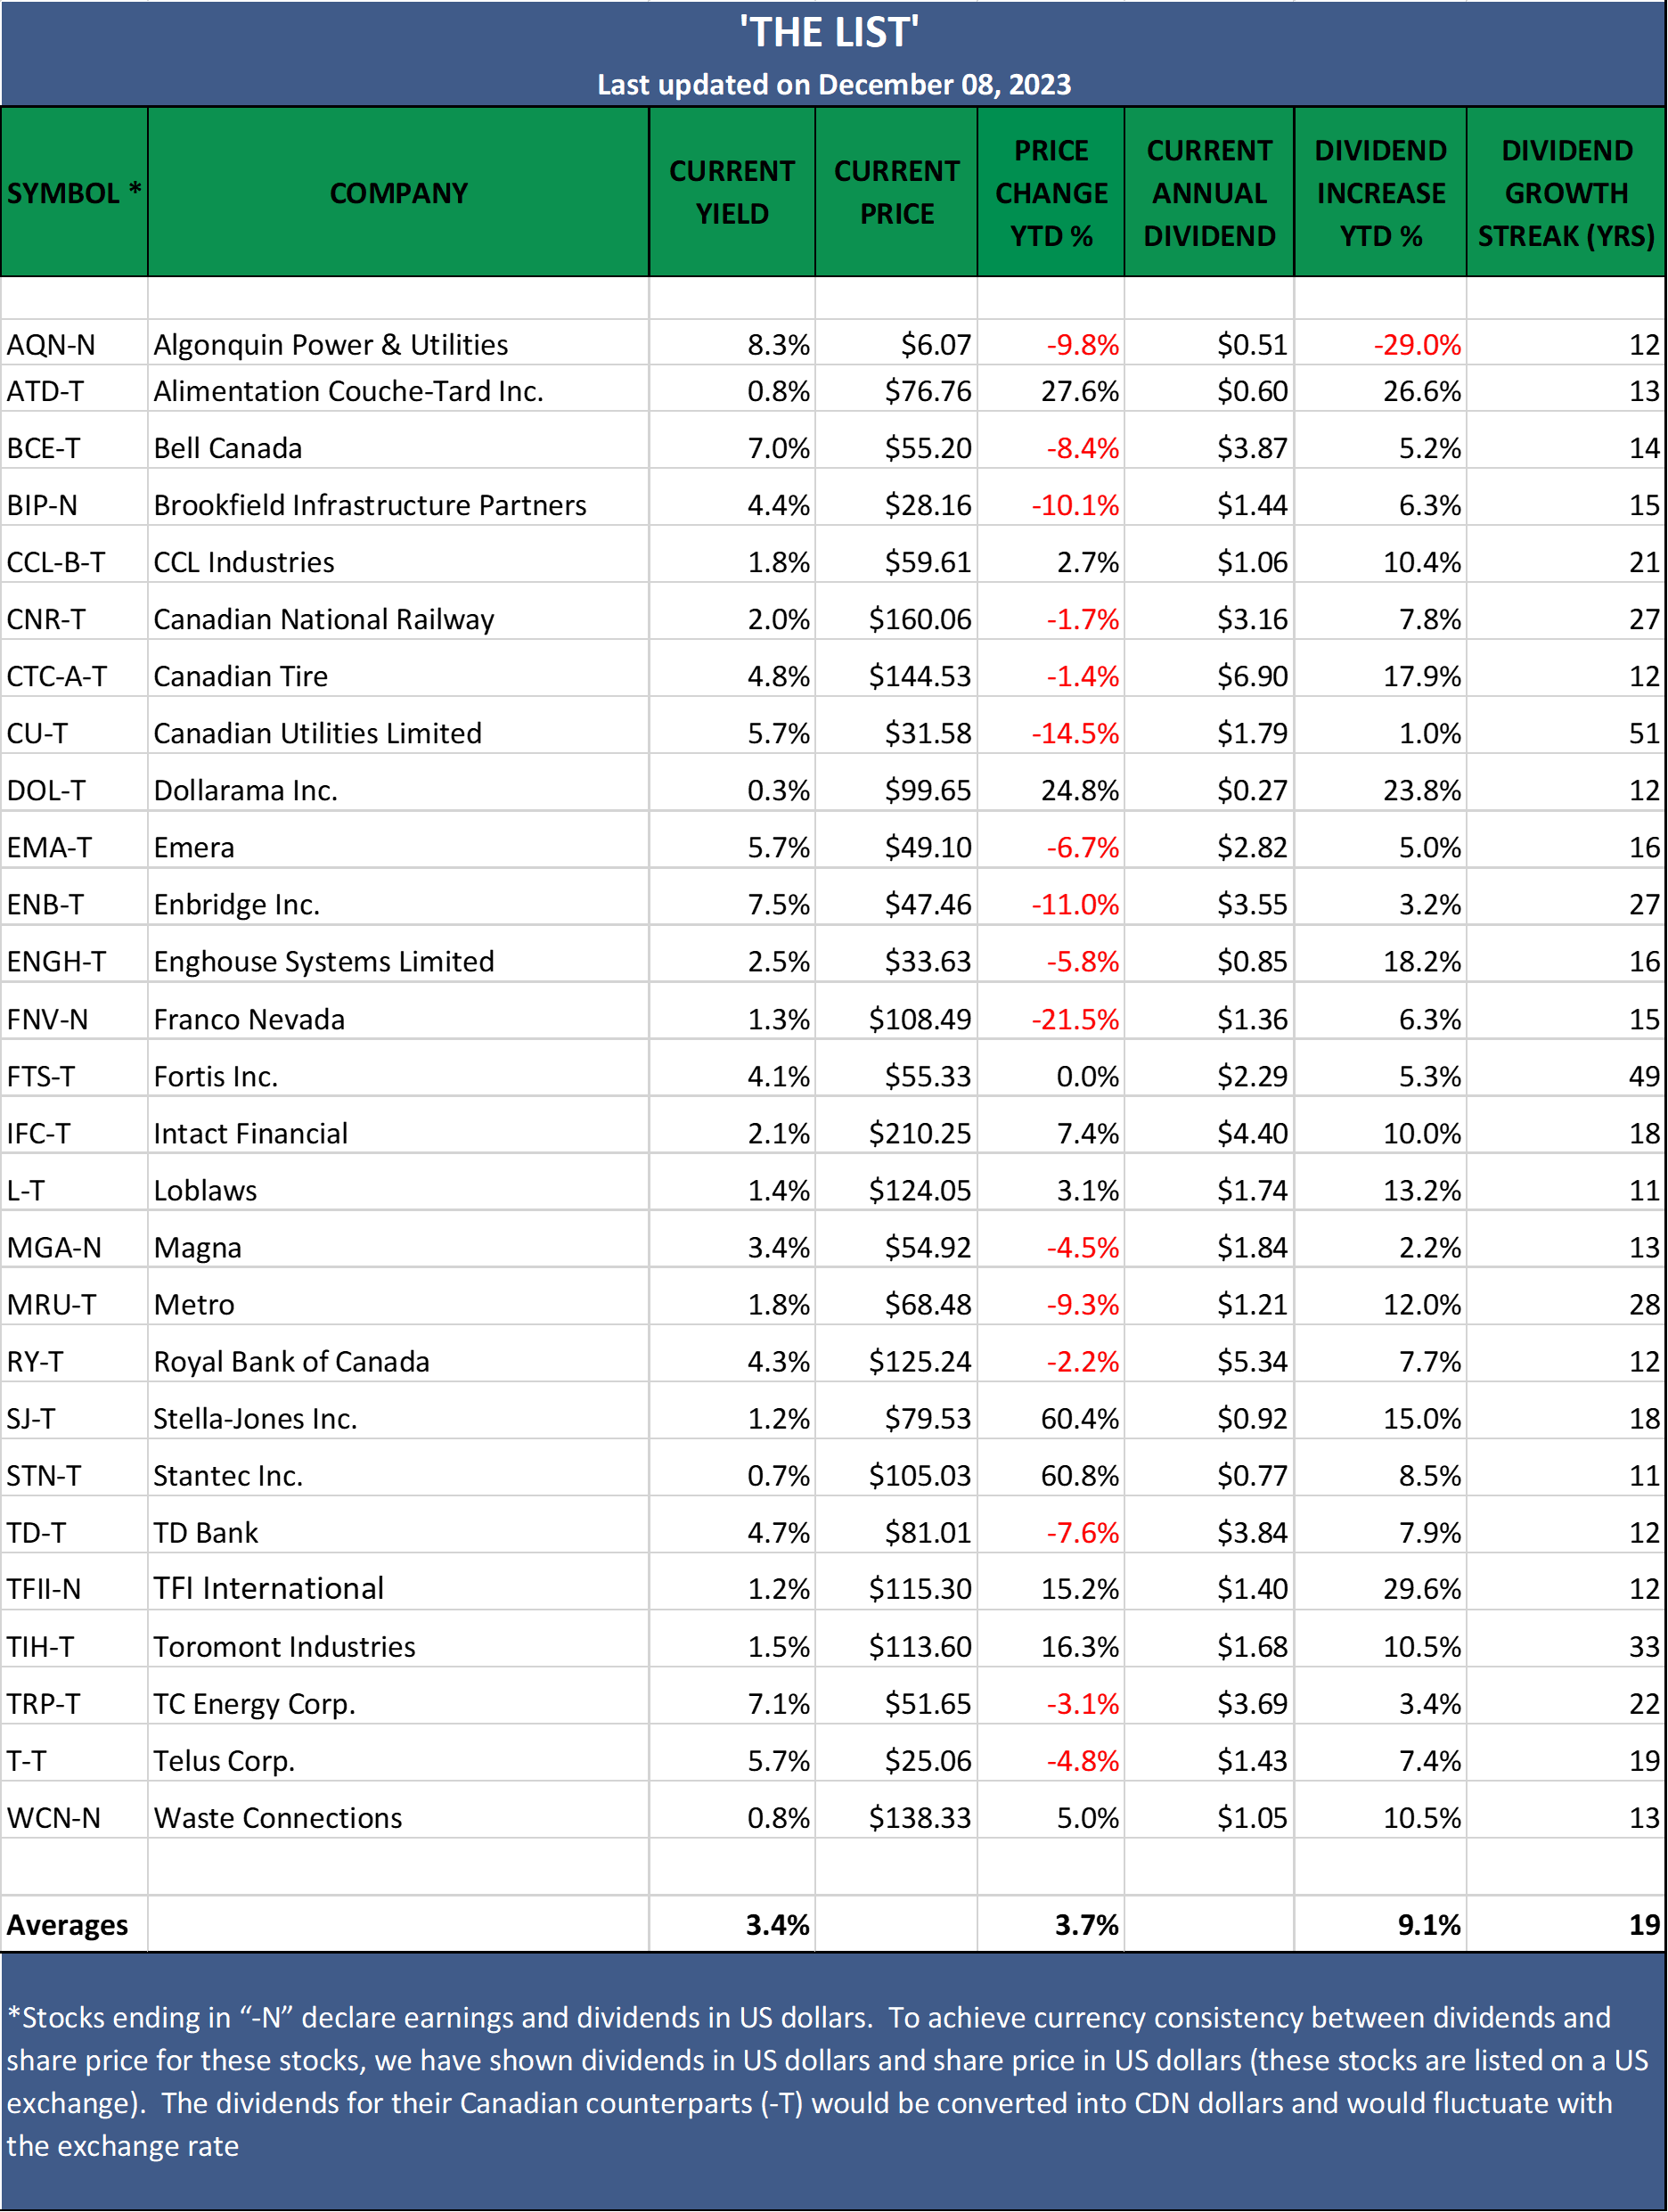
Last week, 'The List' was up with a YTD price return of +3.7% (capital). Dividends have increased by +9.1% YTD, highlighting the growth in the dividend (income).
Last week, there were no dividend announcements from companies on 'The List'.
Last week, there were no earnings reports from companies on 'The List'.
Two companies on 'The List' are due to report earnings this week.
The List (2023)
The Magic Pants List includes 27 Canadian dividend growth stocks. Each have raised their dividend annually for the last ten years (or longer) and have a market cap of over a billion dollars. Based on these criteria, companies on ‘The List’ are added or removed annually, on January 1. Prices and dividends are updated weekly.
While 'The List' does not function as a portfolio on its own, it serves as an excellent initial reference for individuals looking to diversify their investments and achieve higher returns in the Canadian stock market. Through our newsletter, readers gain a deeper understanding of how to implement and benefit from our Canadian dividend growth investing strategy.
If you're interested in creating your own dividend growth income portfolio, consider subscribing to our premium service. Subscribers gain access to buy/sell alerts and exclusive content available only to subscribers.
Performance of 'The List'
Last week, 'The List' was up with a YTD price return of +3.7% (capital). Dividends have increased by +9.1% YTD, highlighting the growth in the dividend (income).
The best performers last week on 'The List' were Loblaws (L-T), up +4.96%; CCL Industries (CCL-B-T), up +3.56%; and Stantec Inc. (STN-T), up +3.08%.
TFI International (TFII-N) was the worst performer last week, down -5.27%.
DGI Clipboard
“You are never going to be successful with every single investment. But if you can consistently keep the odds in your favor over time, you can become the casino and not the guy blowing his paycheck drinking watered-down cocktails at The Flamingo.”
- Daryl Jones, HEDGEYE
Be the casino not the gambler

In a standard game of blackjack played with a single deck and employing basic strategy, the house edge typically hovers around 0.5%. This implies that, on average, the casino maintains a slight advantage over the player. However, variations such as multiple decks, rule adjustments, and player decisions can significantly sway the odds in favor of the casino.
For many investors, navigating the stock market may feel akin to sitting at a blackjack table, especially for those seeking short-term capital gains.
Dividend growth investors take a more disciplined approach. They follow a fundamental strategy and adopt a longer-term investing horizon, distinguishing them from other investors. They can afford to patiently await the fruition of their strategy while enjoying the growth of their income.
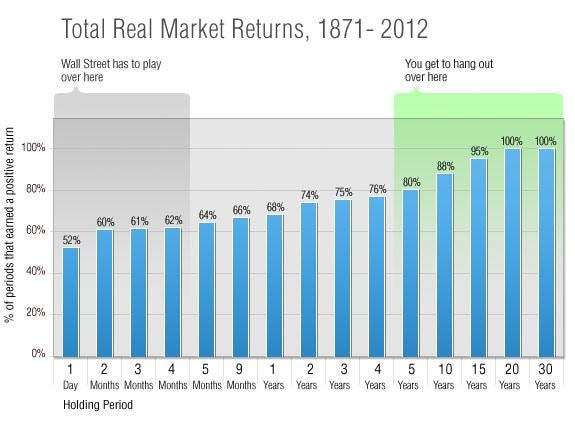
History has shown that the longer the holding period, with all equities, the more likelihood of a positive return. The chart highlights one of the major differences between how the industry pros invest (Wall Street/Bay Street) and investors with a longer-term investing horizon.
In reviewing our trades (timestamps) over the past six years of our dividend growth investing journey, we see this scenario play out.
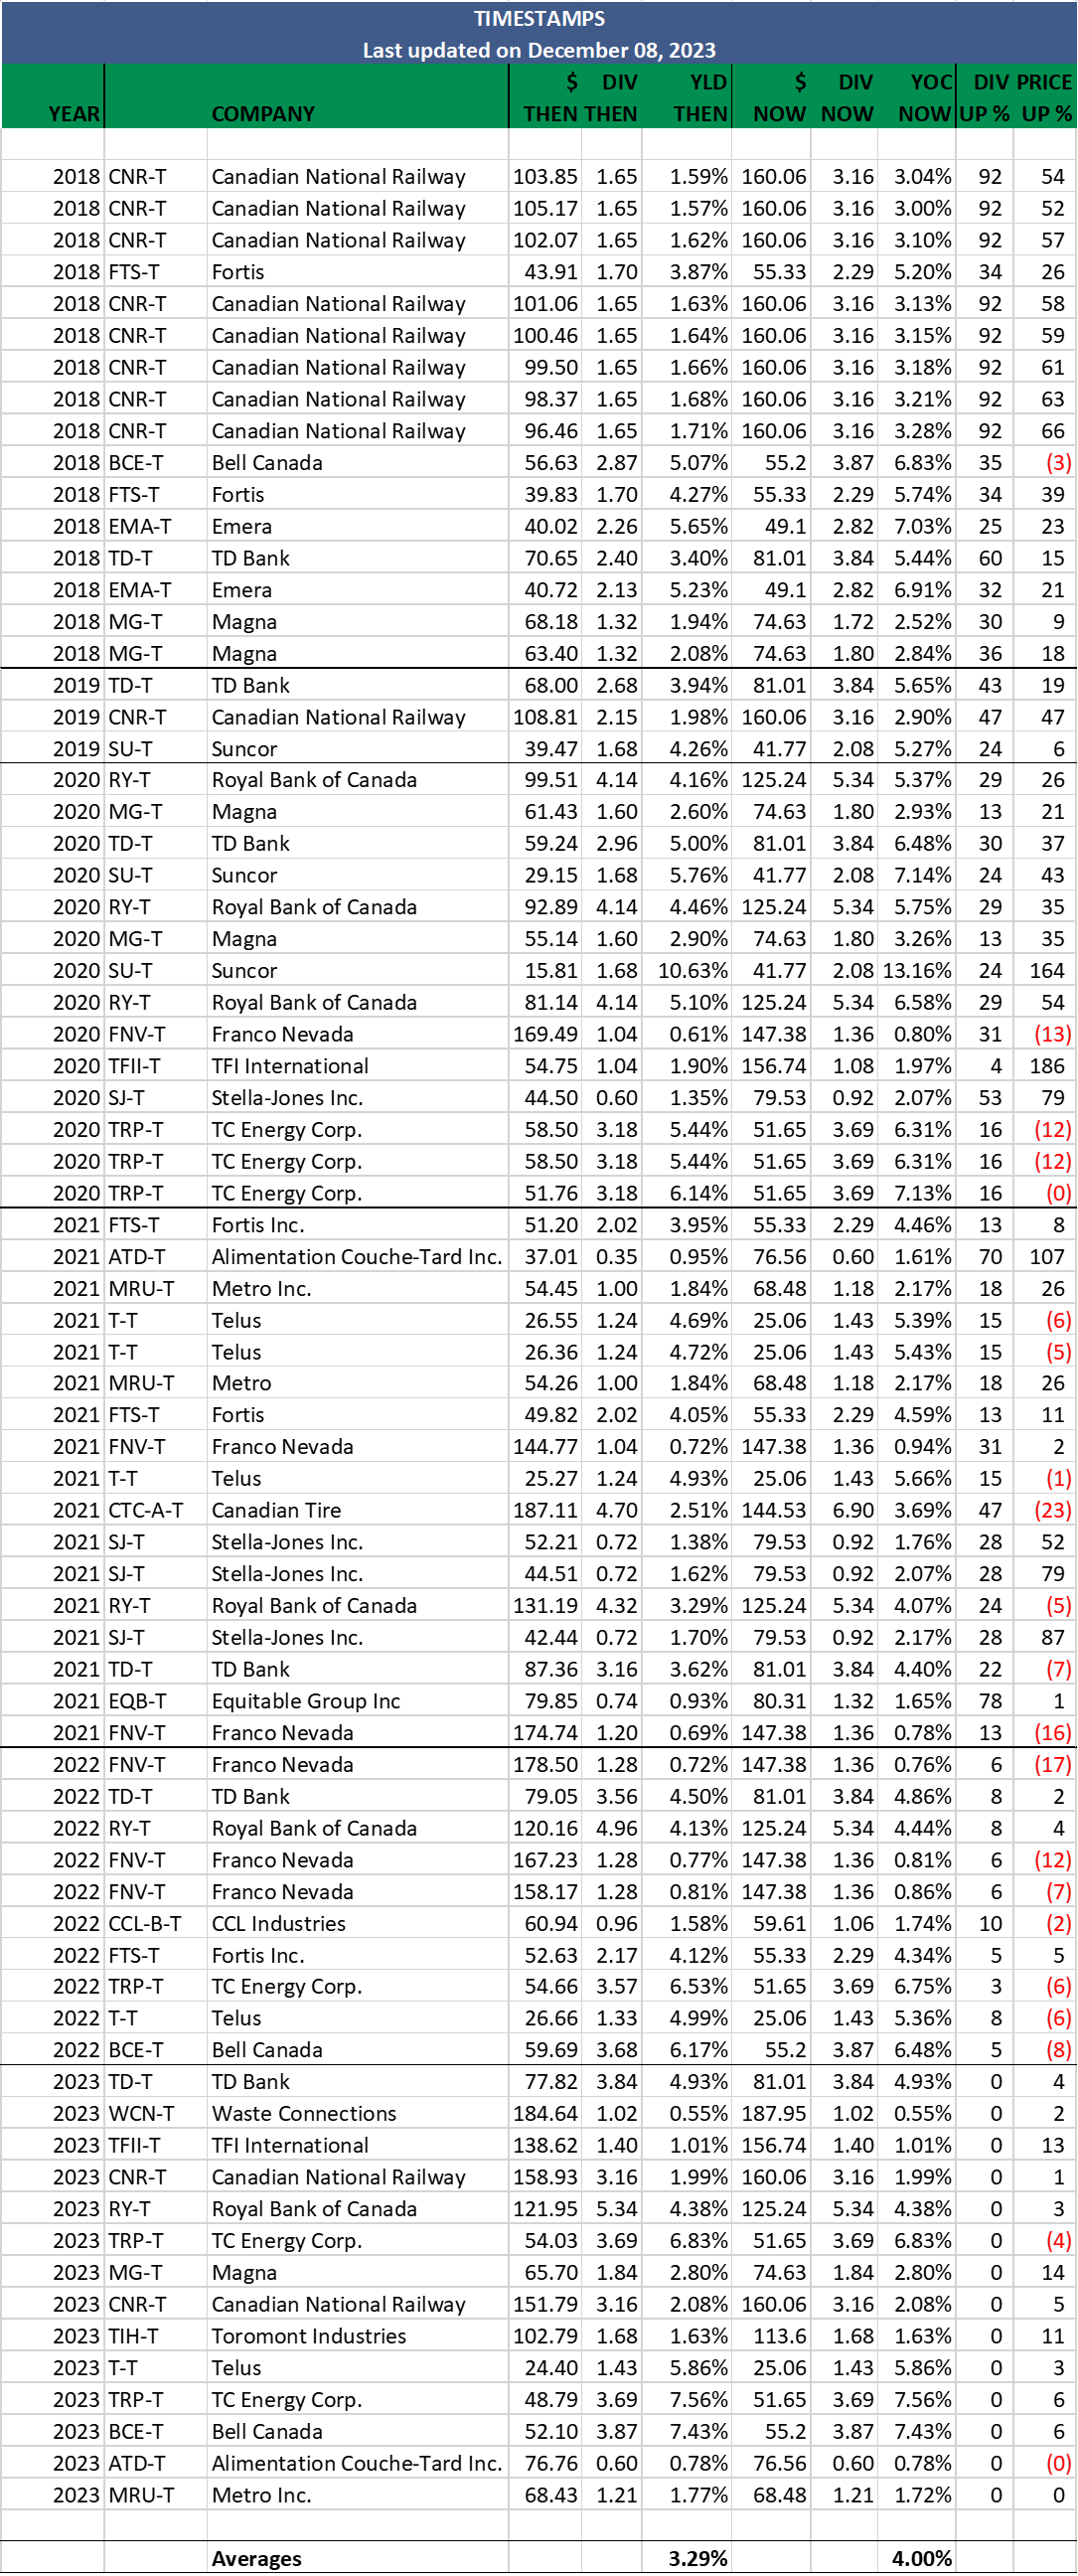
The data in our historical DGI Timestamp chart can be summarized further by dividing the number of trades with positive returns by the number of trades made for each year. The results support our research into why dividend growth investing is one of the best ways to build wealth. First, a rising dividend income stream will eventually lead to rising stock prices. Secondly, the longer the holding period, the greater and more predictable the returns.
Year 1 2023: 86% (12/14) # of positive price returns are volatile.
Year 2 2022: 30% (3/10)
Year 3 2021: 59% (10/17) # of positive price returns stabilizing.
Year 4 2020: 71% (10/14)
Year 5 2019: 100% (3/3) # of positive price returns are highly predictable.
Year 6 2018: 94% (15/16)
Like a casino, we can tilt the odds in our favour with DGI, and by extending our investment time horizon (rule adjustment), we enhance the odds of a positive outcome even further.
For paid subscribers, I’ll go over all the latest earnings reports and any dividend announcements from the companies we follow on ‘The List’. But first, let’s take a closer look at some of the news stories we found relevant last week...
