


Summary
This is not a stock-picking newsletter!
It’s a behind-the-scenes look at how a dividend growth portfolio is built, maintained, and improved over time.
Welcome to this week’s MP Market Review.
Before we begin, a quick explanation of the name.
Many years ago, when I first discovered dividend growth investing, I came across a quote that stopped me in my tracks:
“You have a pair of pants. In the left pocket, you have $100. You take $1 out of the left pocket and put it in the right pocket. You now have $101. There is no diminution of dollars in your left pocket. That is one magic pair of pants.”
That is dividend growth investing in its simplest form.
When a quality company pays a dividend, cash moves from the company’s pocket to yours, yet your ownership stake remains intact. As earnings grow, dividends tend to grow. As dividends grow, share prices often follow. Reinvest those dividends into additional shares, and the cycle accelerates: more shares generate more dividends, which buy even more shares.
That’s the magic.
It’s why we call this newsletter Magic Pants Dividend Growth Investing.
Every week, we track the companies on The List, our curated watchlist of Canadian dividend growth businesses selected for their ability to produce rising income over time. While we also publish a U.S. edition each month, Canada remains our primary hunting ground.
Our objective is straightforward:
Grow dividend income by 7-10%+ annually while achieving long-term capital appreciation that matches or exceeds the TSX Composite in Canada and the S&P 500 in the United States.
What follows is not theory.
It is the real-world application of a dividend growth strategy using real money, real positions, and real results.
Markets create an endless stream of noise. We ignore most of it.
Instead, we focus on a handful of metrics that tell us whether our process is working. No predictions. No forecasts. No crystal ball.
Just results.
The magic is in the dividend. Dividends lead. Prices follow.
This Week’s Scorecard
MP Wealth-Builder Model Portfolio (Canada)
Annualized Total Return: +17.06% since inception
Total Return (includes dividends): +17.02 % year-to-date
Current Yield: 3.2%
The List (Canada)
Dividend Income Growth: +6.6% year-to-date
Capital Appreciation: +6.7% year-to-date
Dividend Announcements Last Week: None
Earnings Reports Last Week: None
Earnings Reports This Week: None
DGI Clipboard
“Remember when the crash arrives, it will be a P/E one, (a valuation decline). Those who bought expensive stocks will get their comeuppance.”
- Tom Connolly
The Business Hasn’t Collapsed. But The Valuation Has.
One of the least understood forces in investing is valuation compression, yet it can have a significant impact on long-term returns.
John Bogle, founder of Vanguard, explained this with a remarkably simple equation:
Total Return = Investment Return + Speculative Return
Investment return comes from the things that truly create shareholder wealth: earnings growth and dividends. Speculative return comes from changes in valuation, or how much investors are willing to pay for those earnings.
That distinction is critical because valuation can change even when a business continues to perform exceptionally well.
Investment Return vs. Speculative Return
Imagine a company that grows earnings by 7% annually while paying a 3% dividend. On paper, investors should expect an investment return of roughly 10% per year before any change in valuation.
Now suppose that the same company once traded at 25 times earnings, but over the next decade, investors decide that 18 times earnings is a more reasonable valuation. The business continues to execute flawlessly. Earnings keep growing. The dividend continues to rise. Yet shareholders may experience years of mediocre price appreciation because the declining P/E multiple offsets part, or even all, of the investment return.
That is valuation compression.
It’s Happening Today
You don’t have to look very far to find examples. Several companies on our watchlists have delivered impressive operational performance while their valuation multiples have begun to normalize.
Stantec and Thomson Reuters in Canada, along with Zoetis, Accenture, and Intuit in the United States, are all exceptional businesses that have experienced some degree of valuation compression after years of premium pricing.
This is why investors should be cautious when markets become expensive. Elevated valuations don’t necessarily mean stock prices are about to fall. They simply lower the probability of earning outsized future returns because much of tomorrow’s optimism has already been reflected in today’s price.
Why Dividend Growth Investors Have an Edge
Fortunately, dividend growth investors have an advantage.
Our objective has never been to profit from expanding valuation multiples. We invest in exceptional businesses that consistently grow earnings and increase their dividends. Those two characteristics are the true engines of long-term wealth creation.
Even when valuations compress, the dividend continues to arrive. Better yet, reinvested dividends buy more shares while prices are lower, increasing future dividend income and positioning the portfolio to benefit when valuations eventually stabilize.
Patience Is Part of the Process
This is why patience is such an important part of dividend growth investing. Markets can spend years correcting excessive valuations while the underlying businesses continue to grow.
Investors focused only on share prices often become discouraged. Investors focused on a growing stream of dividend income recognize these periods as opportunities rather than setbacks.
John Bogle’s formula reminds us that we cannot control investor sentiment. We can, however, control the quality of the businesses we own and the prices we are willing to pay.
Takeaway
Over time, earnings growth and dividends do the heavy lifting. Valuation may enhance returns for a while, but it eventually reverts toward normal. When it does, investment return is what remains, and that is where lasting wealth is created.
Looking for a helping hand in the market? Members of Magic Pants Dividend Growth Investing get exclusive ideas and guidance to navigate any climate.
The Magic Pants model portfolios (Canadian and American) are real-money, dividend-growth portfolios funded with actual capital and executed in live accounts. Every position shown is owned, sized, and tracked in real time using our disciplined DGI process.
Become a PAID subscriber, and I’ll show you exactly how I do it. In addition, gain full access to this post and exclusive, subscriber-only content. We do the work; you stay in control!
DGI Scorecard
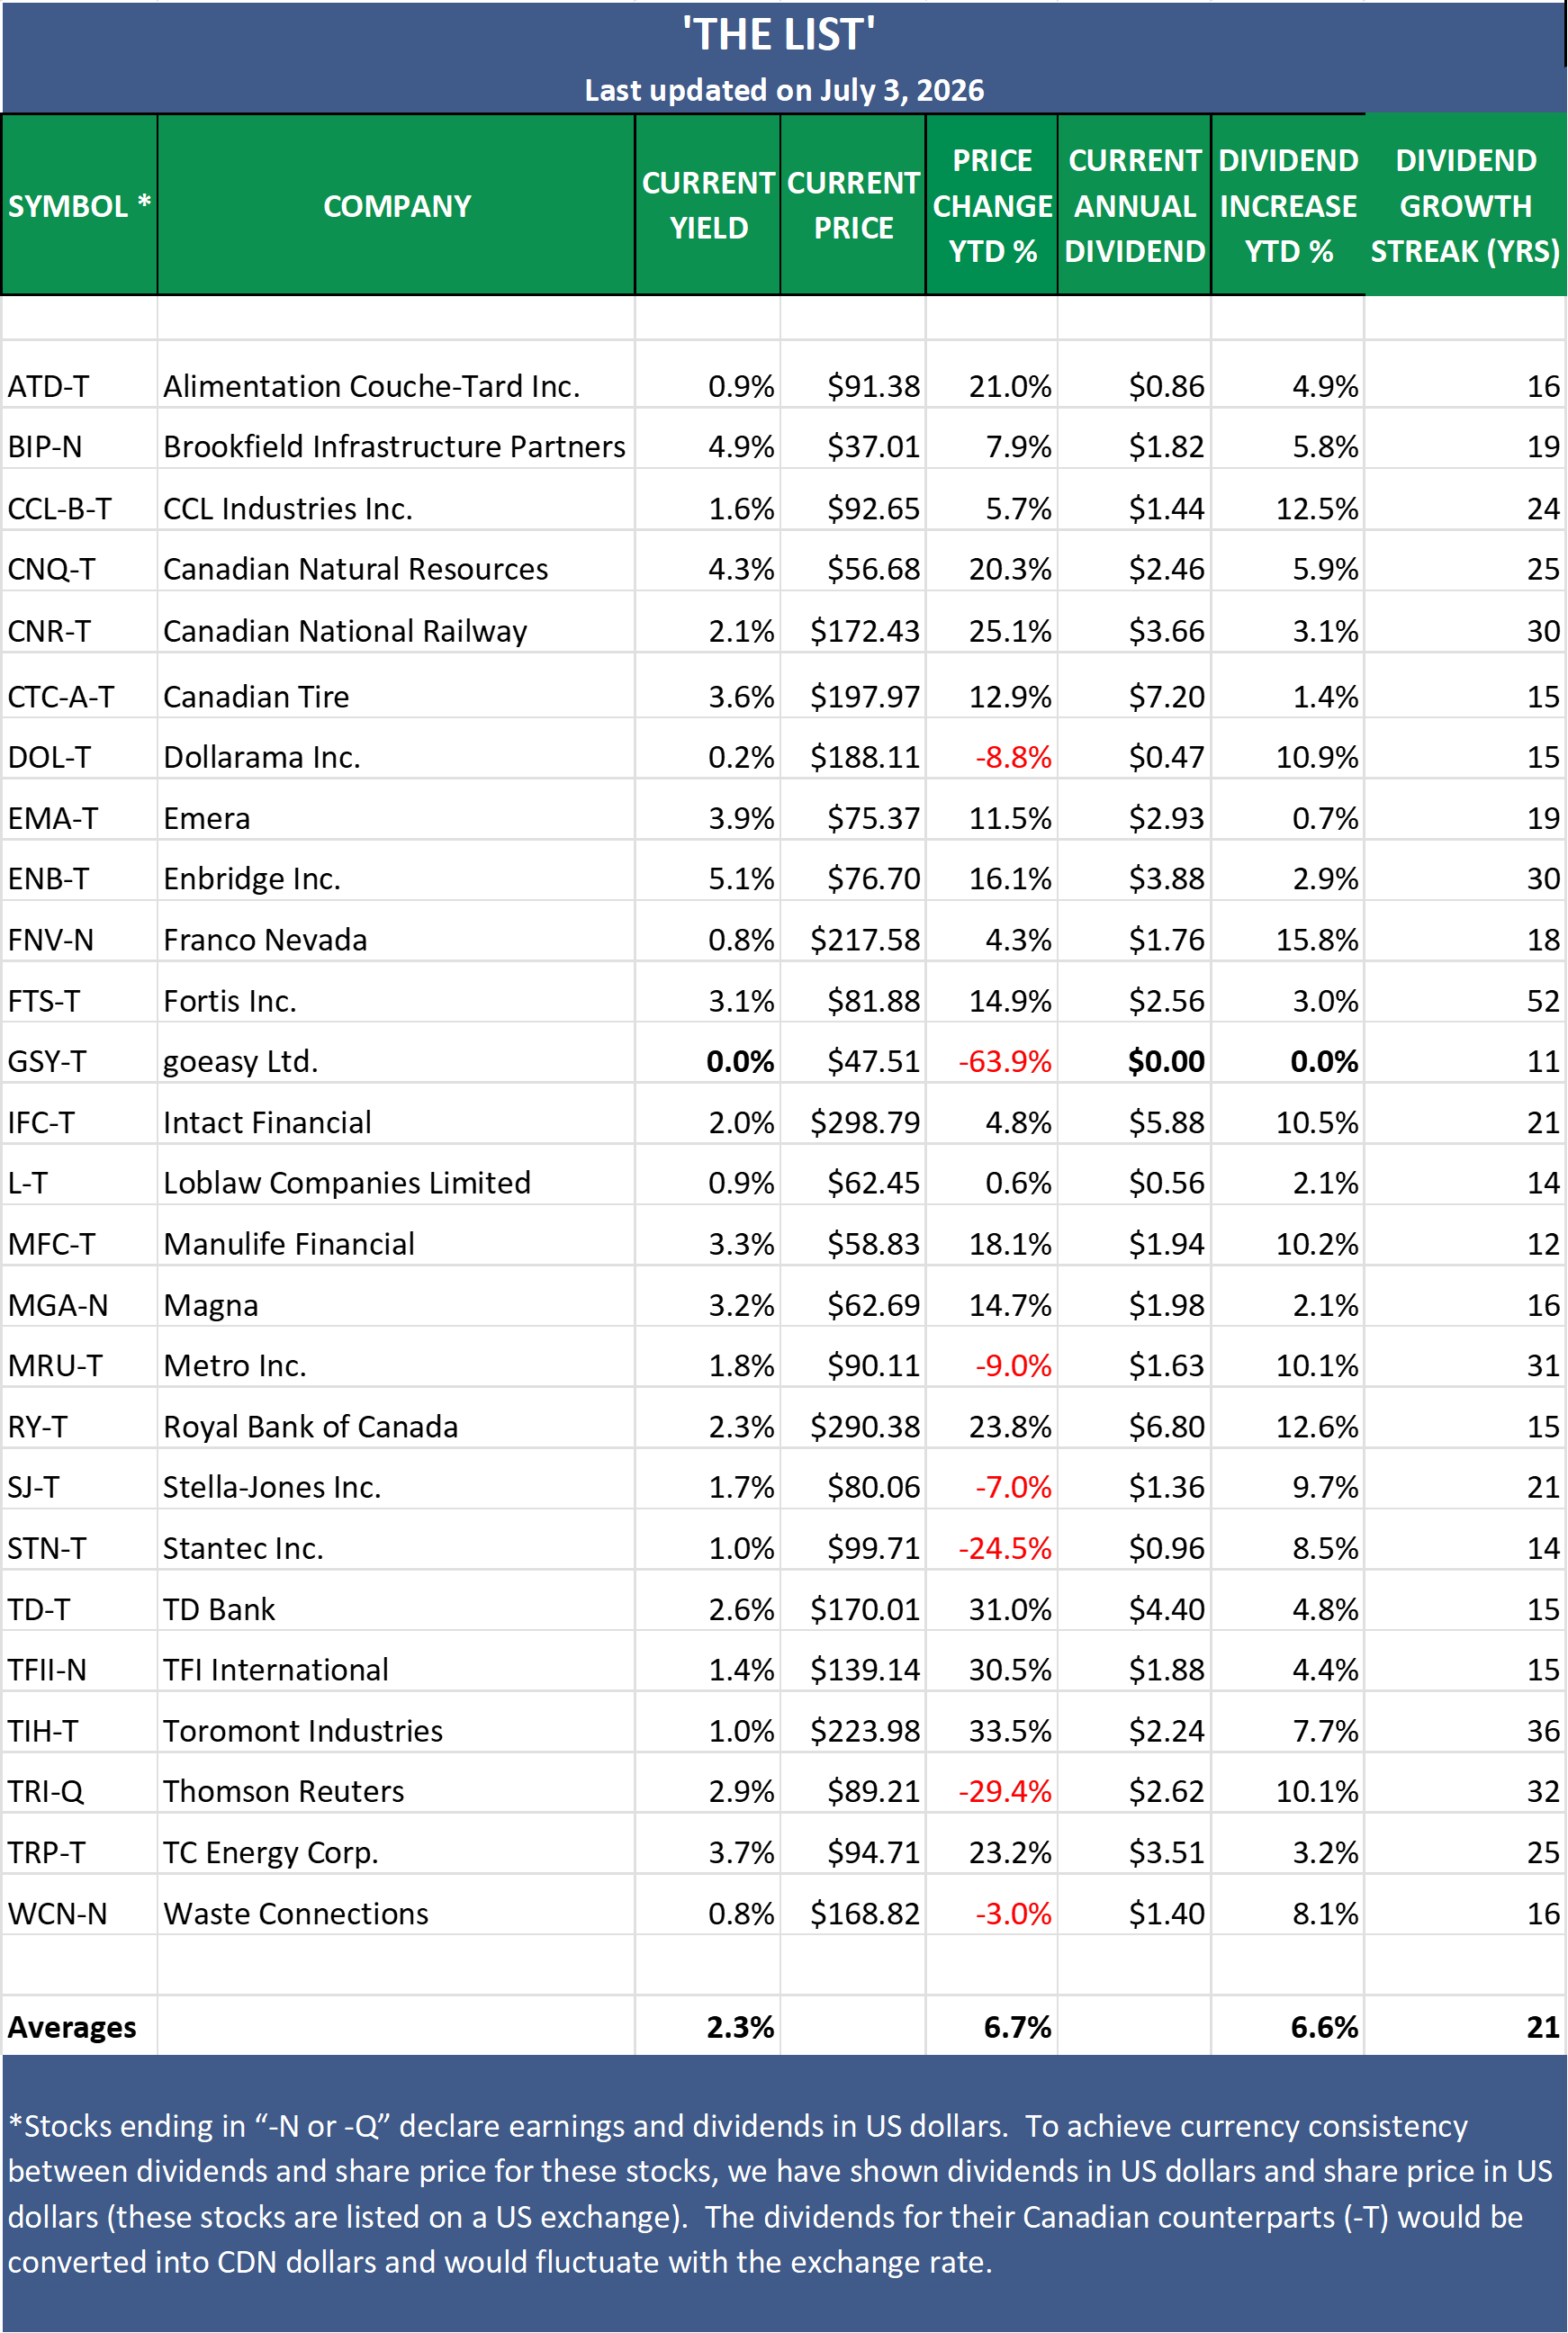
The Magic Pants 2026 list (The List) includes 26 Canadian dividend growth stocks, and our new American watchlist (The List-USA) contains 28 companies. Here are the criteria to be considered a candidate on our watchlists:
Dividend growth streak: 10 years or more.
Market cap: Minimum one billion dollars.
Diversification: Limit of five companies per sector, preferably two per industry.
Cyclicality: Exclude REITs and pure-play energy companies due to high cyclicality.
Based on these criteria, companies are added or removed from ‘The List’ annually on January 1. Prices and dividends are updated weekly.
‘The List’ is not a portfolio but a coaching tool that helps us think about ideas and risk manage our model portfolio. We own some but not all the companies on ‘The List’. In other words, we might want to buy these companies when valuation looks attractive.
Our newsletter provides readers with a comprehensive insight into the implementation and advantages of our dividend growth investing strategy. This evidence-based, unbiased approach empowers DIY investors to outperform both actively managed dividend funds and passively managed indexes and dividend ETFs over longer-term horizons.
Note: In the last week of every month, I will show the updated watchlist for our American dividend growers, The List-USA. It will be shown after the Canadian watchlist below.
Performance of 'The List'
The dividend growth for The List remained unchanged last week, with an average YTD increase of 6.6% (income).
The price of The List was down last week and now stands at +6.7% YTD (capital).
Top Performers Last Week:
goeasy Ltd. (GSY-T), up +18.54%.
Thomson Reuters (TRI-Q), up +6.37%.
Manulife Financial (MFC-T), up +2.87%.
Worst Performer Last Week:
Loblaw Companies Limited (L-T), down -5.28%.
From breaking news to quarterly earnings reports, we break down the week’s biggest headlines to help you make sense of the market.
