


We build our powerful DGI portfolios one trade at a time. Active at first and passive over time.
Welcome to this week’s MP Market Review, where we put our dividend growth investing (DGI) process into practice with real money, real positions, and real results.
The model portfolios I share are my own, funded with my own capital. Every purchase, addition, trim, and sale is timestamped and accompanied by a DGI Alert explaining what we did and why. Subscribers can follow each decision as it happens and watch how it plays out over time.
Each quarter, we review the complete trade history alongside our growing dividend income, including the wins, the losses, and the decisions I would make differently today.
That transparency earns trust. We don’t just show you the results. We show you the decisions behind them.
This week, we go one step further. We take you inside our research process, step by step, to show you how a stock earns its place in our portfolio.
IN THIS ISSUE: DGI Clipboard • DGI Scorecard • DGI News • DGI Updates • Earnings Releases
DGI Clipboard
“It’s a market of stocks, not a stock market.”
— Chuck Carnevale
Inside Our Process: How a Stock Earns a Place in Our Portfolio
Six purchases in one week is unusual for our model portfolios.
We bought one new dividend growth stock and added to five existing positions. Each purchase had to earn its place.
Building a dividend growth portfolio takes upfront work. When we buy a quality business at a sensible price, its dividend starts adding to our income while we give the business time to grow. You can see the income and capital returns from one of our model portfolios in the latest Portfolio Letter. As we like to say: dividends lead, prices follow.
So what made these stocks worth buying now?
In this article, I’ll walk through one of last week’s purchases to give you an inside look at how we research a stock when it's on our radar. It also appeared in our Timely Ten list just a few weeks ago. I’ll show you what put it there, how we judged its current quality and valuation, and why we decided it was time to act.
A Quality Business Under Pressure
Waste Connections, Inc. (WCN) is an integrated solid waste services company providing non-hazardous waste collection, transfer and disposal, recycling and renewable fuels recovery, oilfield waste services, and intermodal services across the U.S. and Canada.
The company serves approximately nine million residential, commercial and industrial customers.
Operationally, its latest quarter was strong.
Q2 revenue increased 6.4%, adjusted EBITDA increased 6.8%, and adjusted EPS increased more than 16% year over year. The company also reported underlying margin expansion, strong free cash flow, substantial share repurchases and an increase to its full-year outlook.
So if Waste Connections appears to be firing on most cylinders, why has the share price recently come under pressure?
Part of the answer appears to be valuation.
Waste Connections has historically commanded a premium valuation. Even after the recent pullback, investors still have to decide whether that premium is justified by the company’s quality and expected growth.
That is where our analysis begins.
Quality Indicators
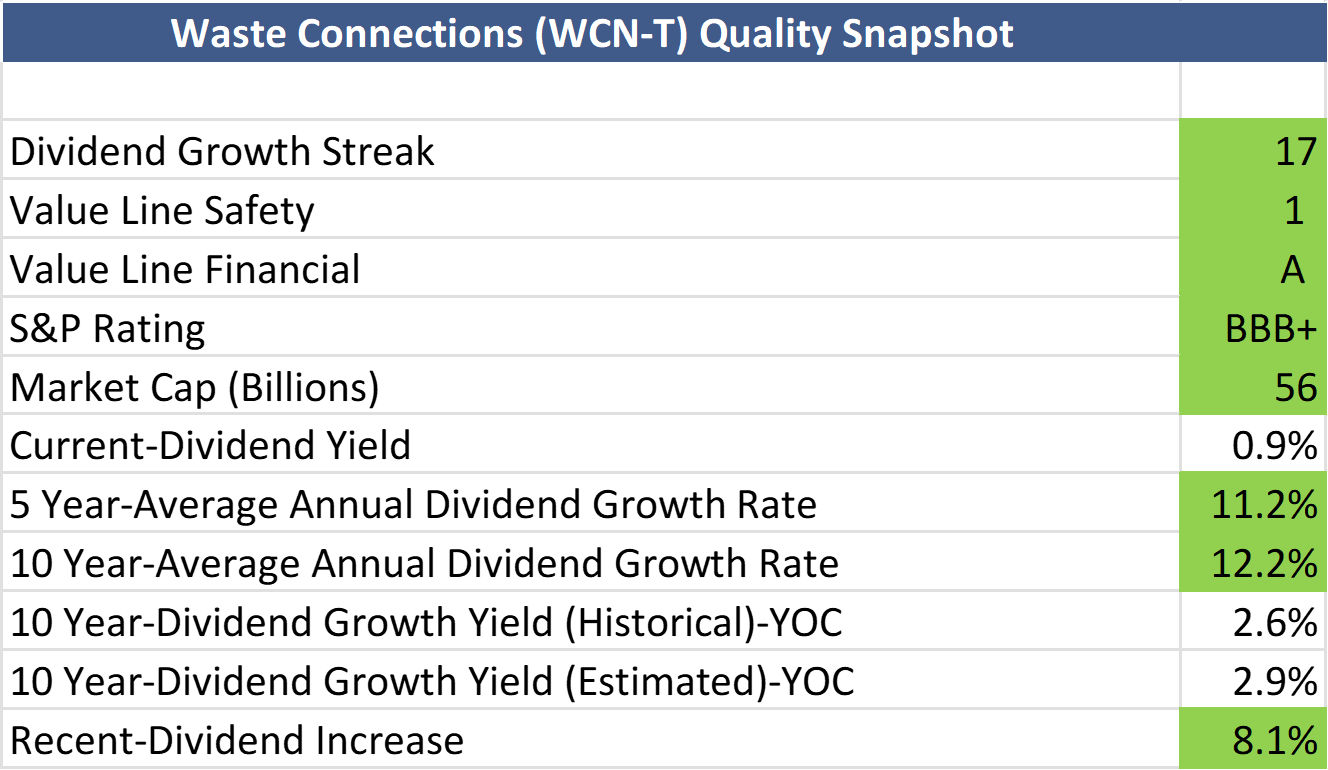
We look at several indicators when assessing the quality of the dividend growth companies we follow.
Very few businesses satisfy every criterion. But generally, the more quality indicators a company checks off, the more interested we become.
For Waste Connections, we are particularly interested in the durability of its business, the consistency of earnings and cash flow growth, its dividend growth record, its payout ratio, and the balance between growth and shareholder returns.
Valuation
Quality alone is not enough.
Regardless of how much we like a business, we exercise caution when initiating or adding to a position unless we believe the shares are sensibly priced.
For valuation work, we find YCharts and FAST Graphs particularly useful because they allow us to compare today’s valuation with the way a company has historically traded.
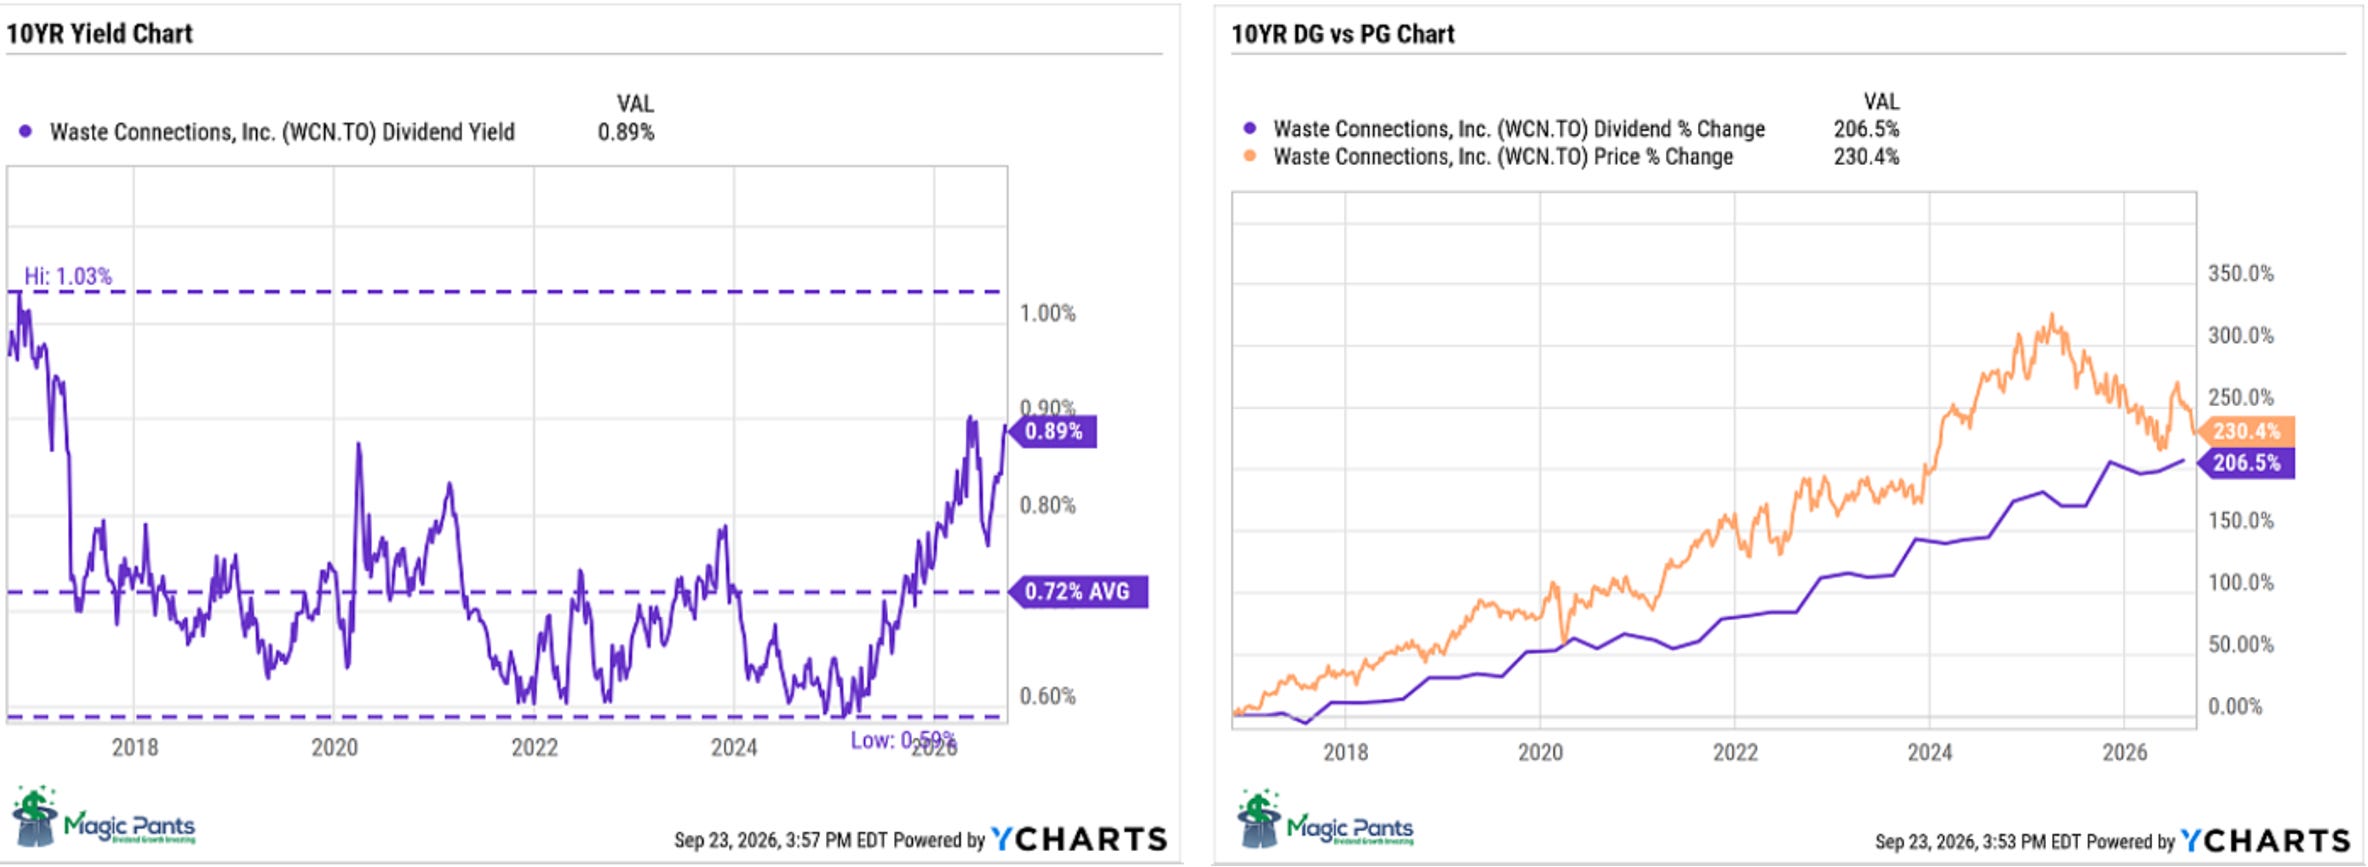
10YR Yield Chart
Dividend Yield Theory offers a simple way to think about the valuation of established dividend growth companies.
The basic idea is that a quality company’s dividend yield may gravitate around a historical range over long periods, provided its business model, growth profile and dividend policy have not materially changed.
When the current yield rises meaningfully above its historical average, it can be a signal that the shares have become less expensive relative to their own history.
It isn’t a guarantee that the stock price will revert to its historical valuation, but it gives us another useful reference point.
10YR DG vs PG Chart
This is one of our favourite relationships to study.
Over long periods, we like to see dividend growth and share-price growth moving in roughly the same direction. When they do, it provides evidence that a growing underlying business supports the rising dividend.
For dividend growth investors, that’s an important relationship:
Source: YCHARTS
Over time, a growing business supports a growing dividend, and a growing dividend can help lift the share price.
Historical Fundamentals
Over the long run, operating results drive stock prices.
Prices can mislead in the short term. Fundamentals tell us how the business is actually performing.
Studying a company’s historical fundamentals also tells us a great deal about how investors have traditionally valued the business.
Many of the companies we follow trade within what we call a valuation corridor. Their valuations fluctuate, sometimes significantly, but tend to remain within a recognizable historical range.
We examine measures including:
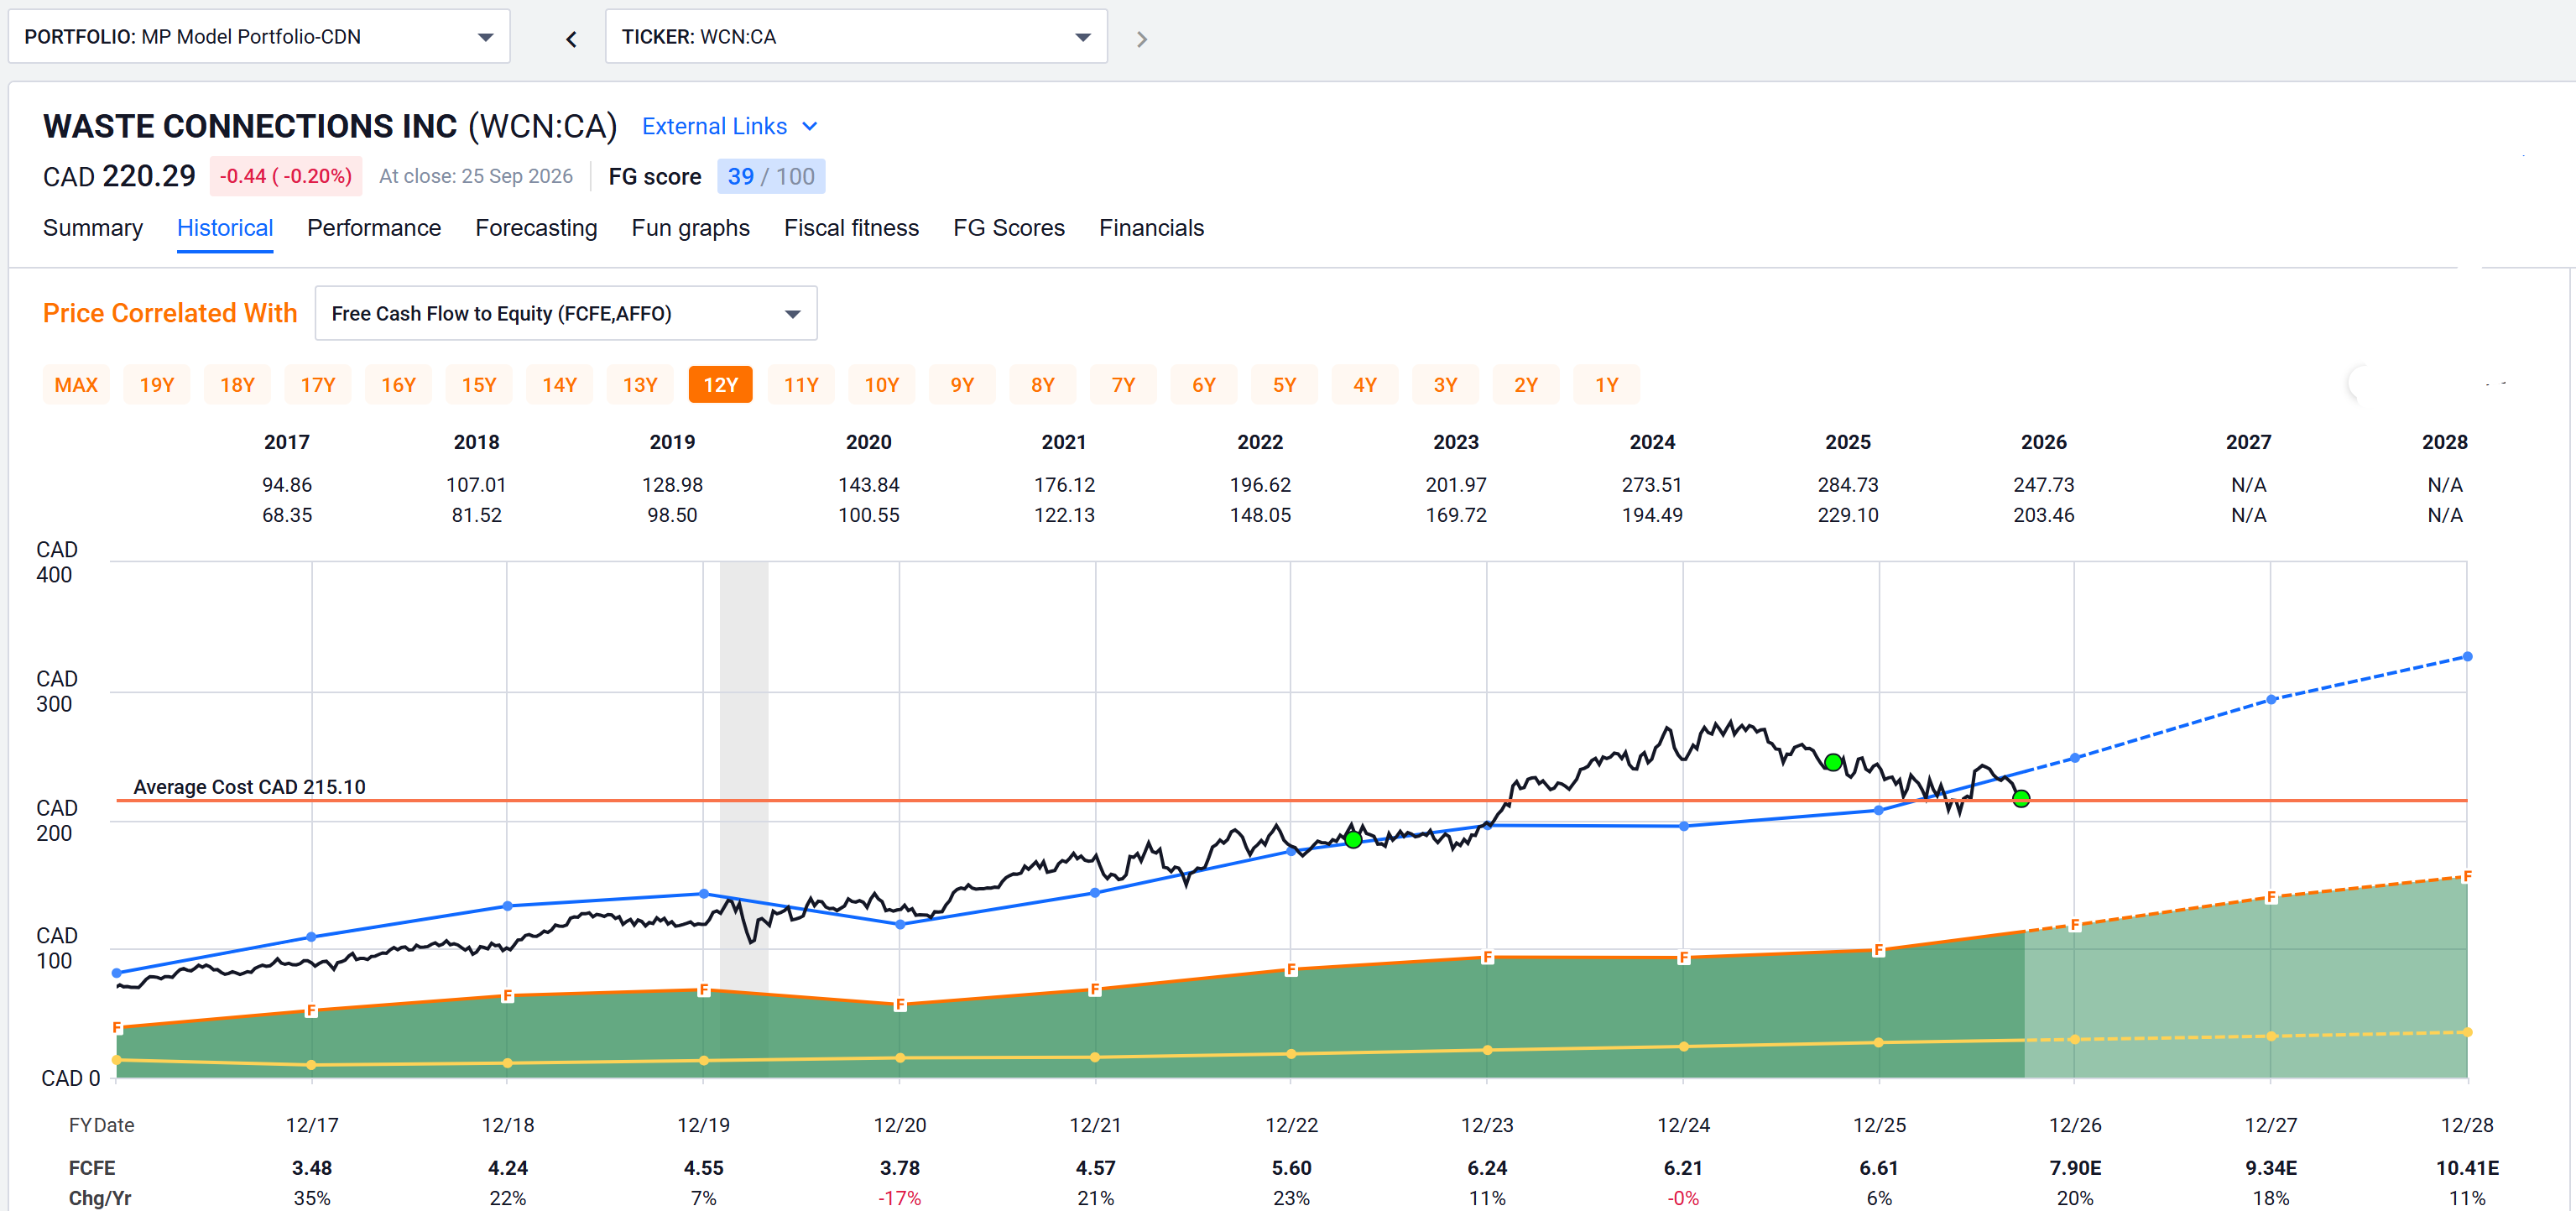
Price to Adjusted Operating Earnings • Price to Operating Cash Flow • Free Cash Flow to Equity • EBITDA • Price to Sales
Buying toward the lower end of these historical ranges, rather than chasing shares near the upper end, can help us establish more attractive entry points.
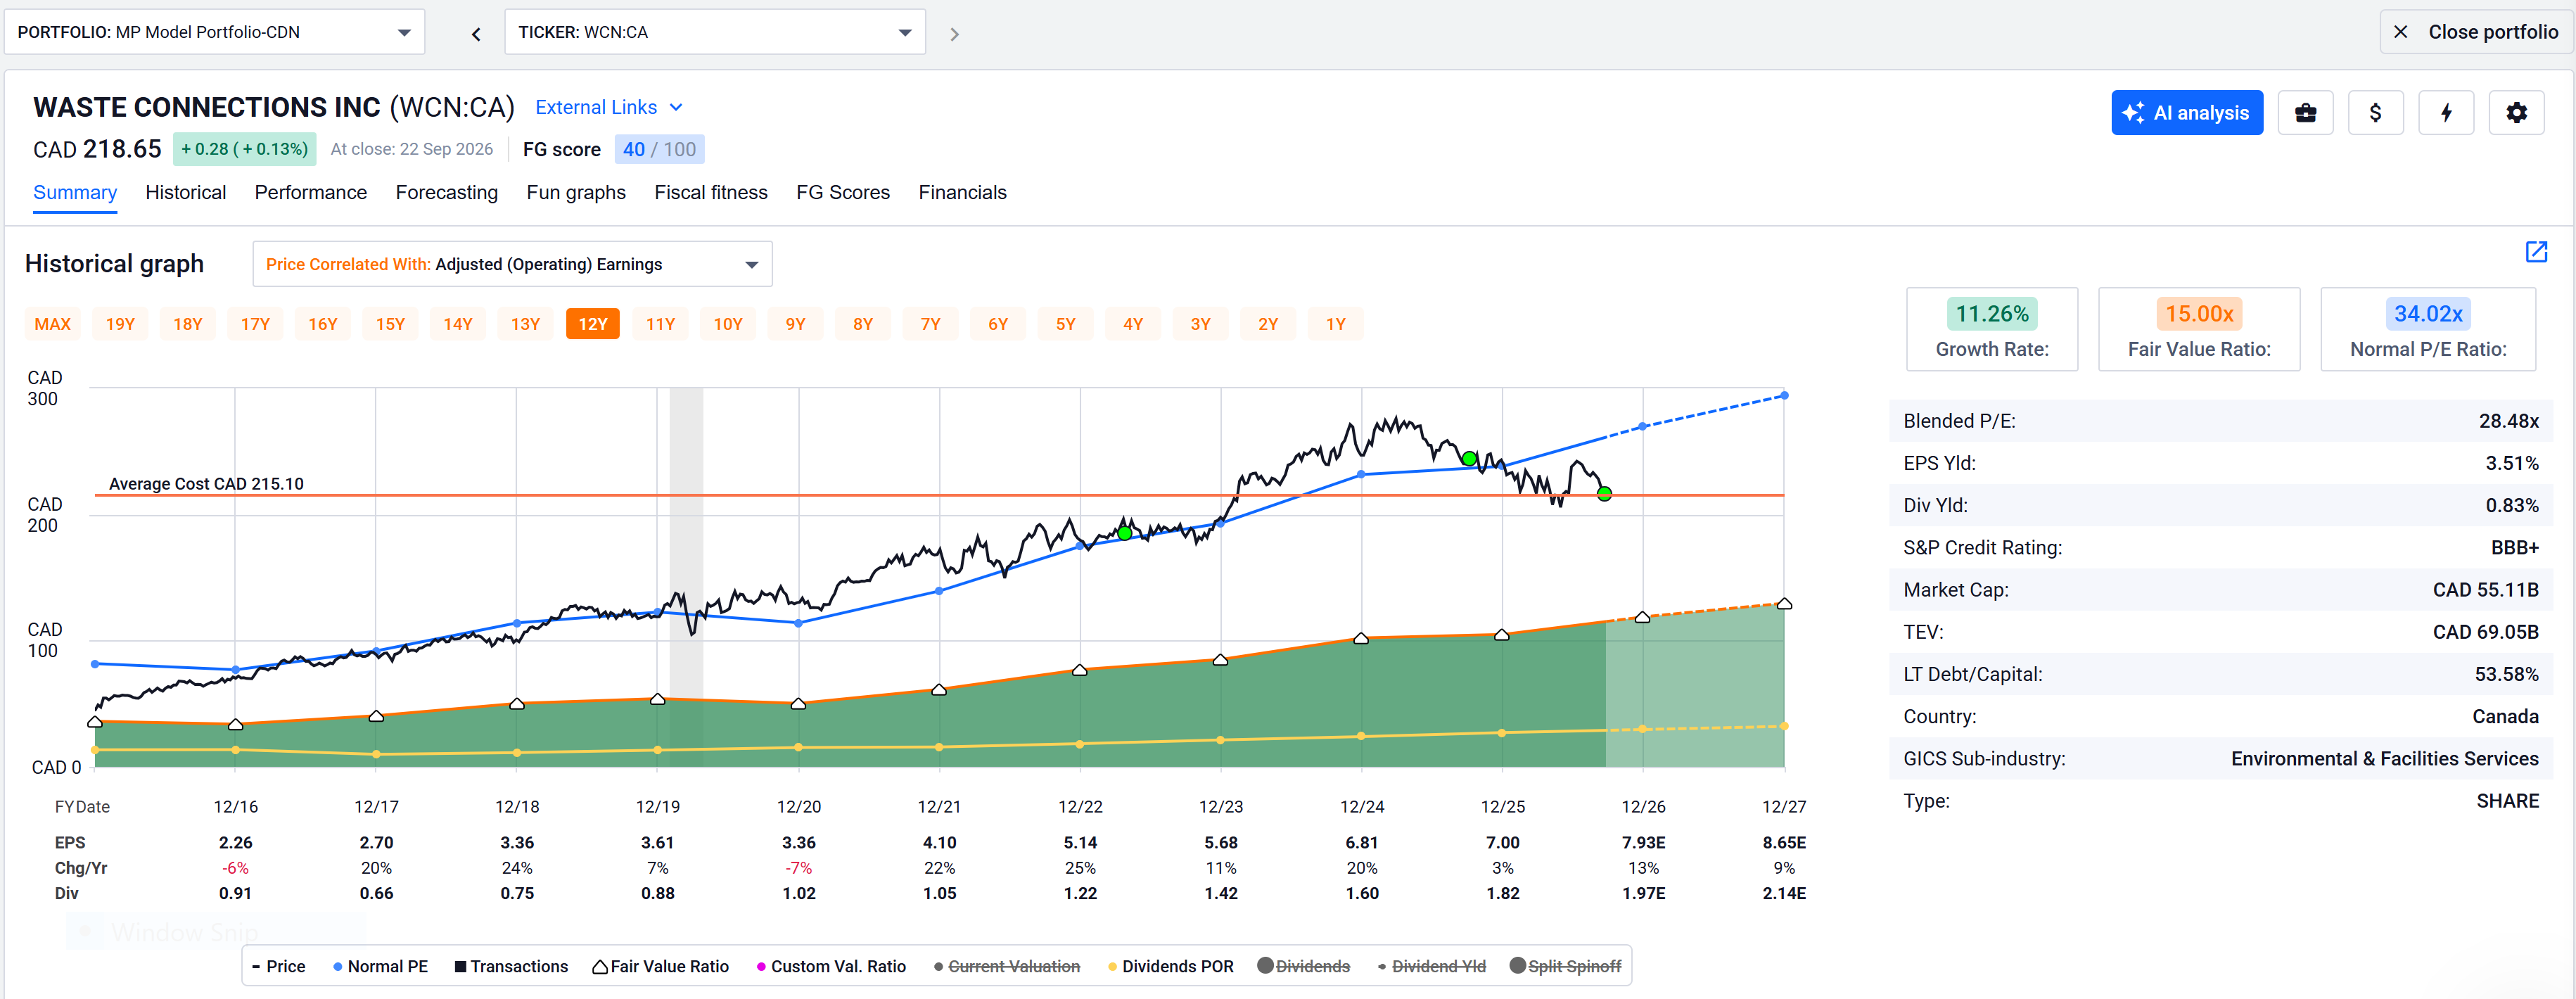
We use FAST Graphs to visualize these relationships, typically over a 10-to-12-year period. This gives us a view across different market and economic environments rather than relying on a single year’s valuation.
How to Read Our FAST Graphs
Black line: Price
White line: Dividend
Orange line: Graham average of usually 15 P/E (price/earnings) for most stocks
Yellow Line: Dividend Payout Ratio
Blue line: Normal P/E
Dashed or dotted lines: Estimates only
Green area: Earnings
Green dots: Purchases
Source: FASTgraphs
Forecasting
“You can learn from the past, but you make money on the future.”
- Chuck Carnevale
Historical valuation tells us where a stock has been.
Forecasting asks the more important question:
What rate of return can we reasonably expect from an investment made today?
We separate that potential return into two components: dividend return and capital return.
Dividend Return
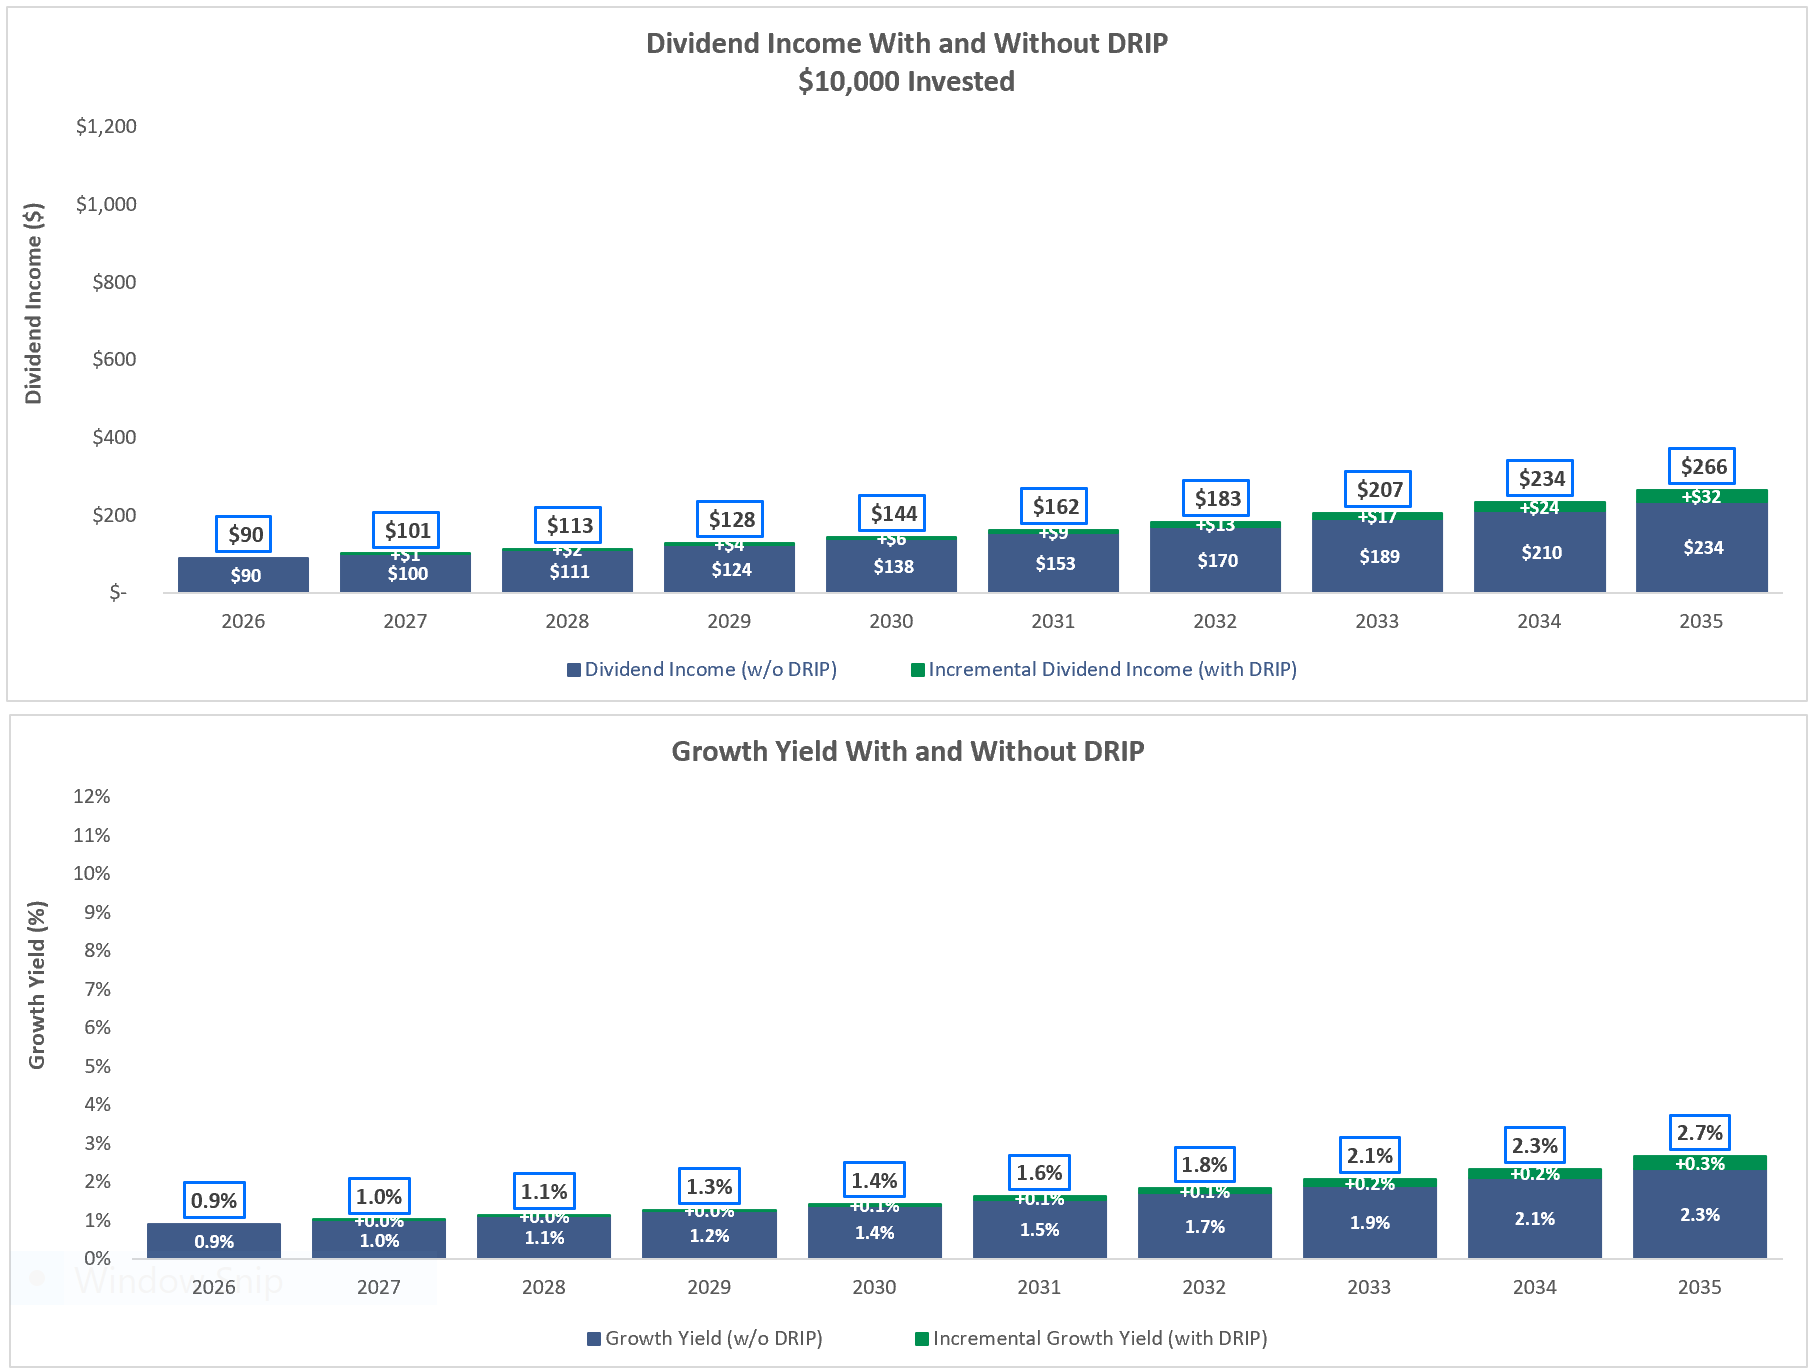
Our growth yield measures the annual dividend relative to our original purchase price. It is similar to what is commonly called yield on cost.
We prefer the term growth yield because it emphasizes the part of the equation that matters most to our strategy: the dividend has grown.
Waste Connections is not a high-yield stock today. That’s important. An investor buying WCN shouldn’t expect substantial immediate income.
Instead, the attraction is the potential combination of a modest starting yield and strong dividend growth.
With the right combination of starting yield, dividend growth and reinvestment through a DRIP, we generally aim for our growth yield to eventually reach the 7% to 10% range.
Capital Return
The second part of the equation is potential capital appreciation.
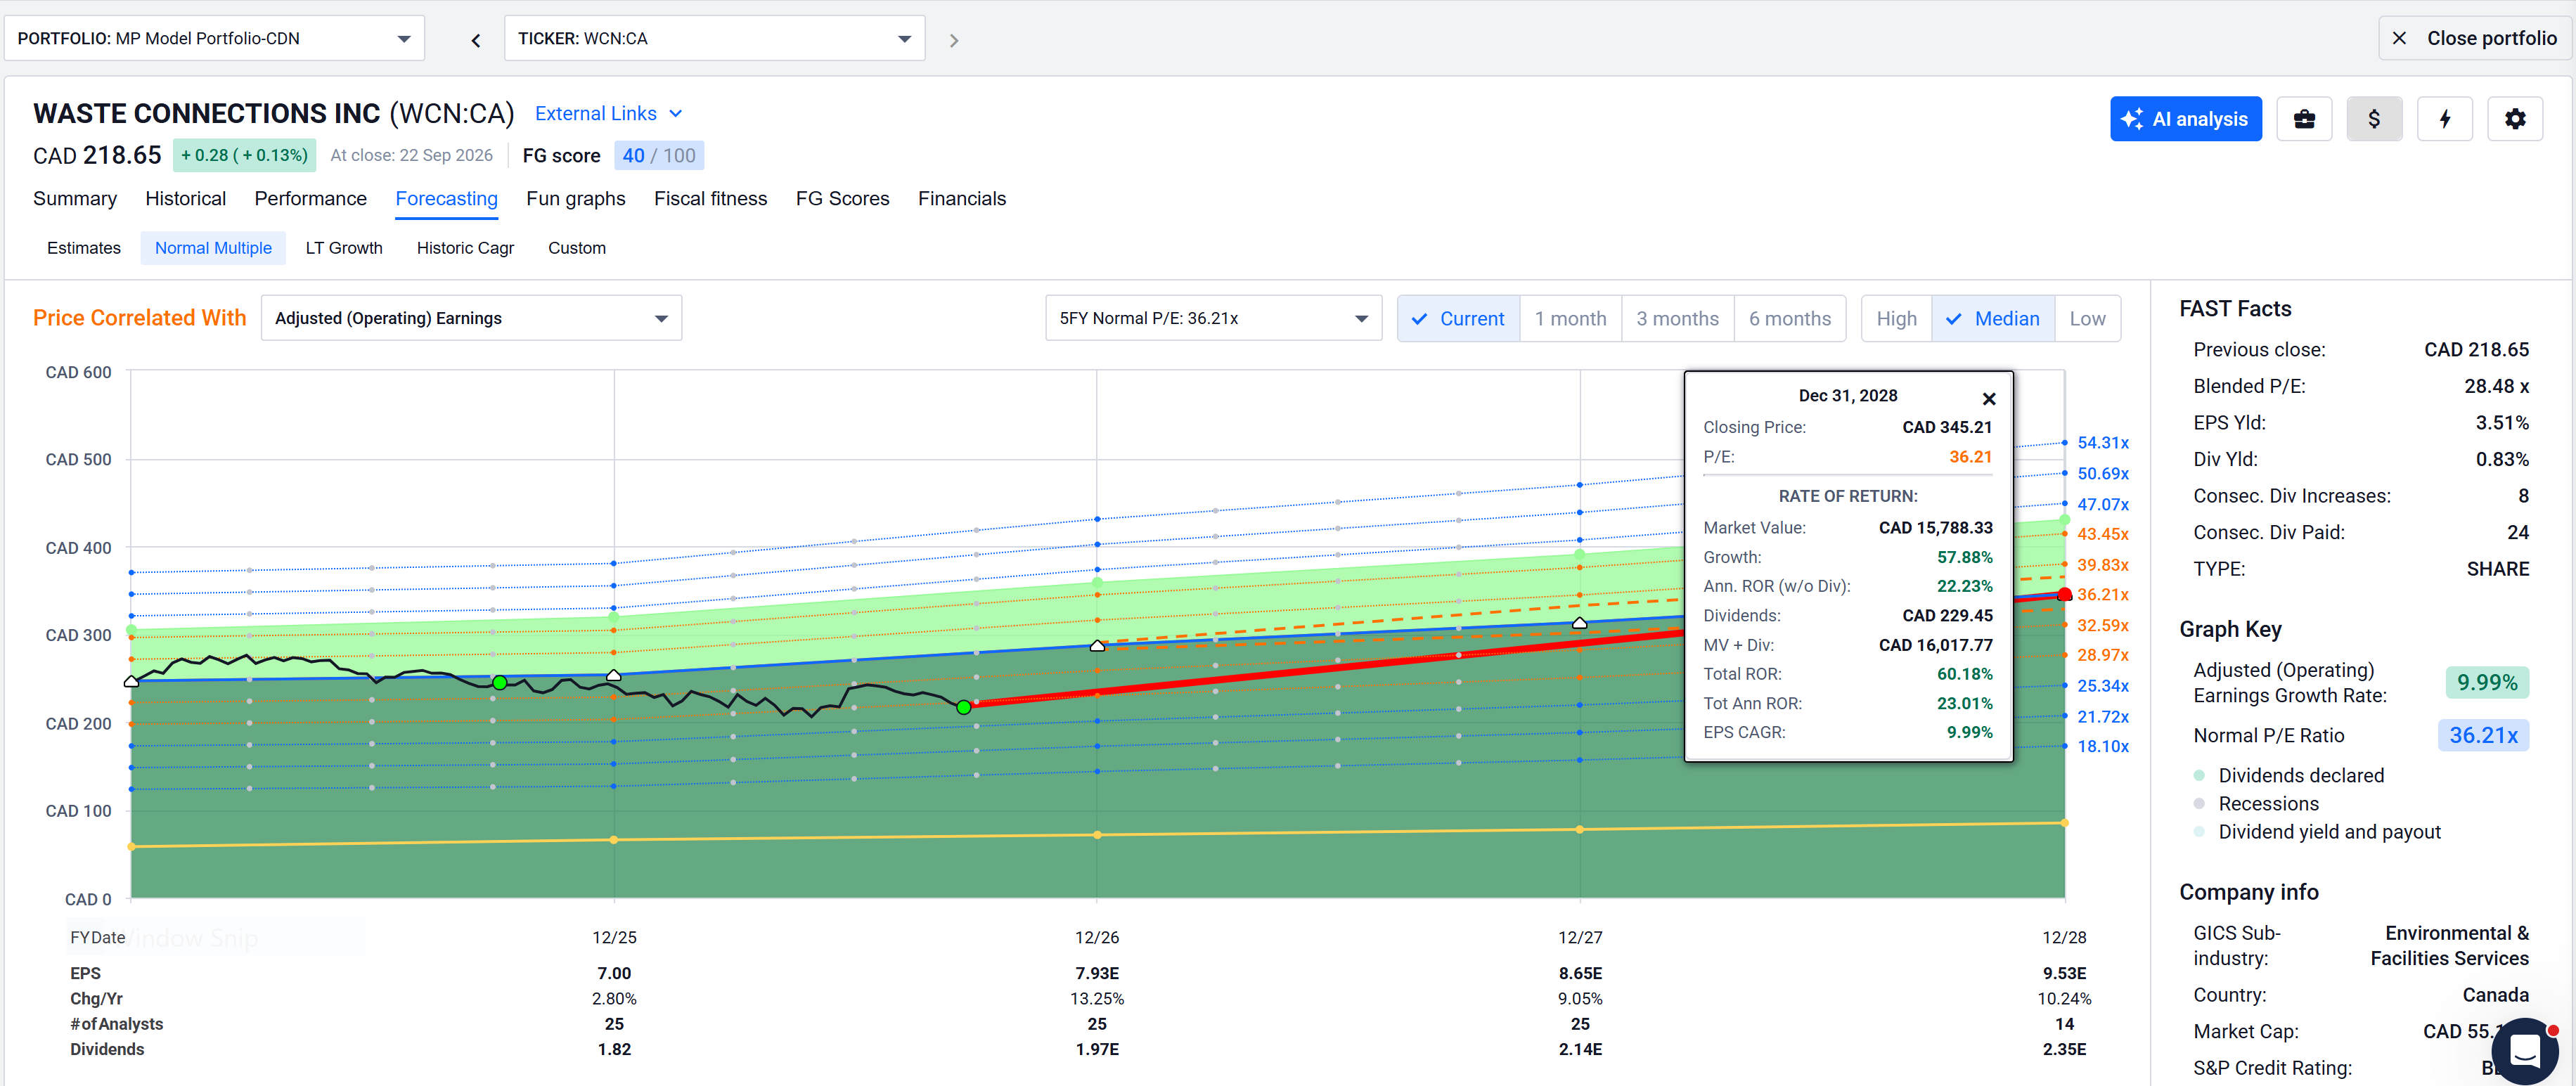
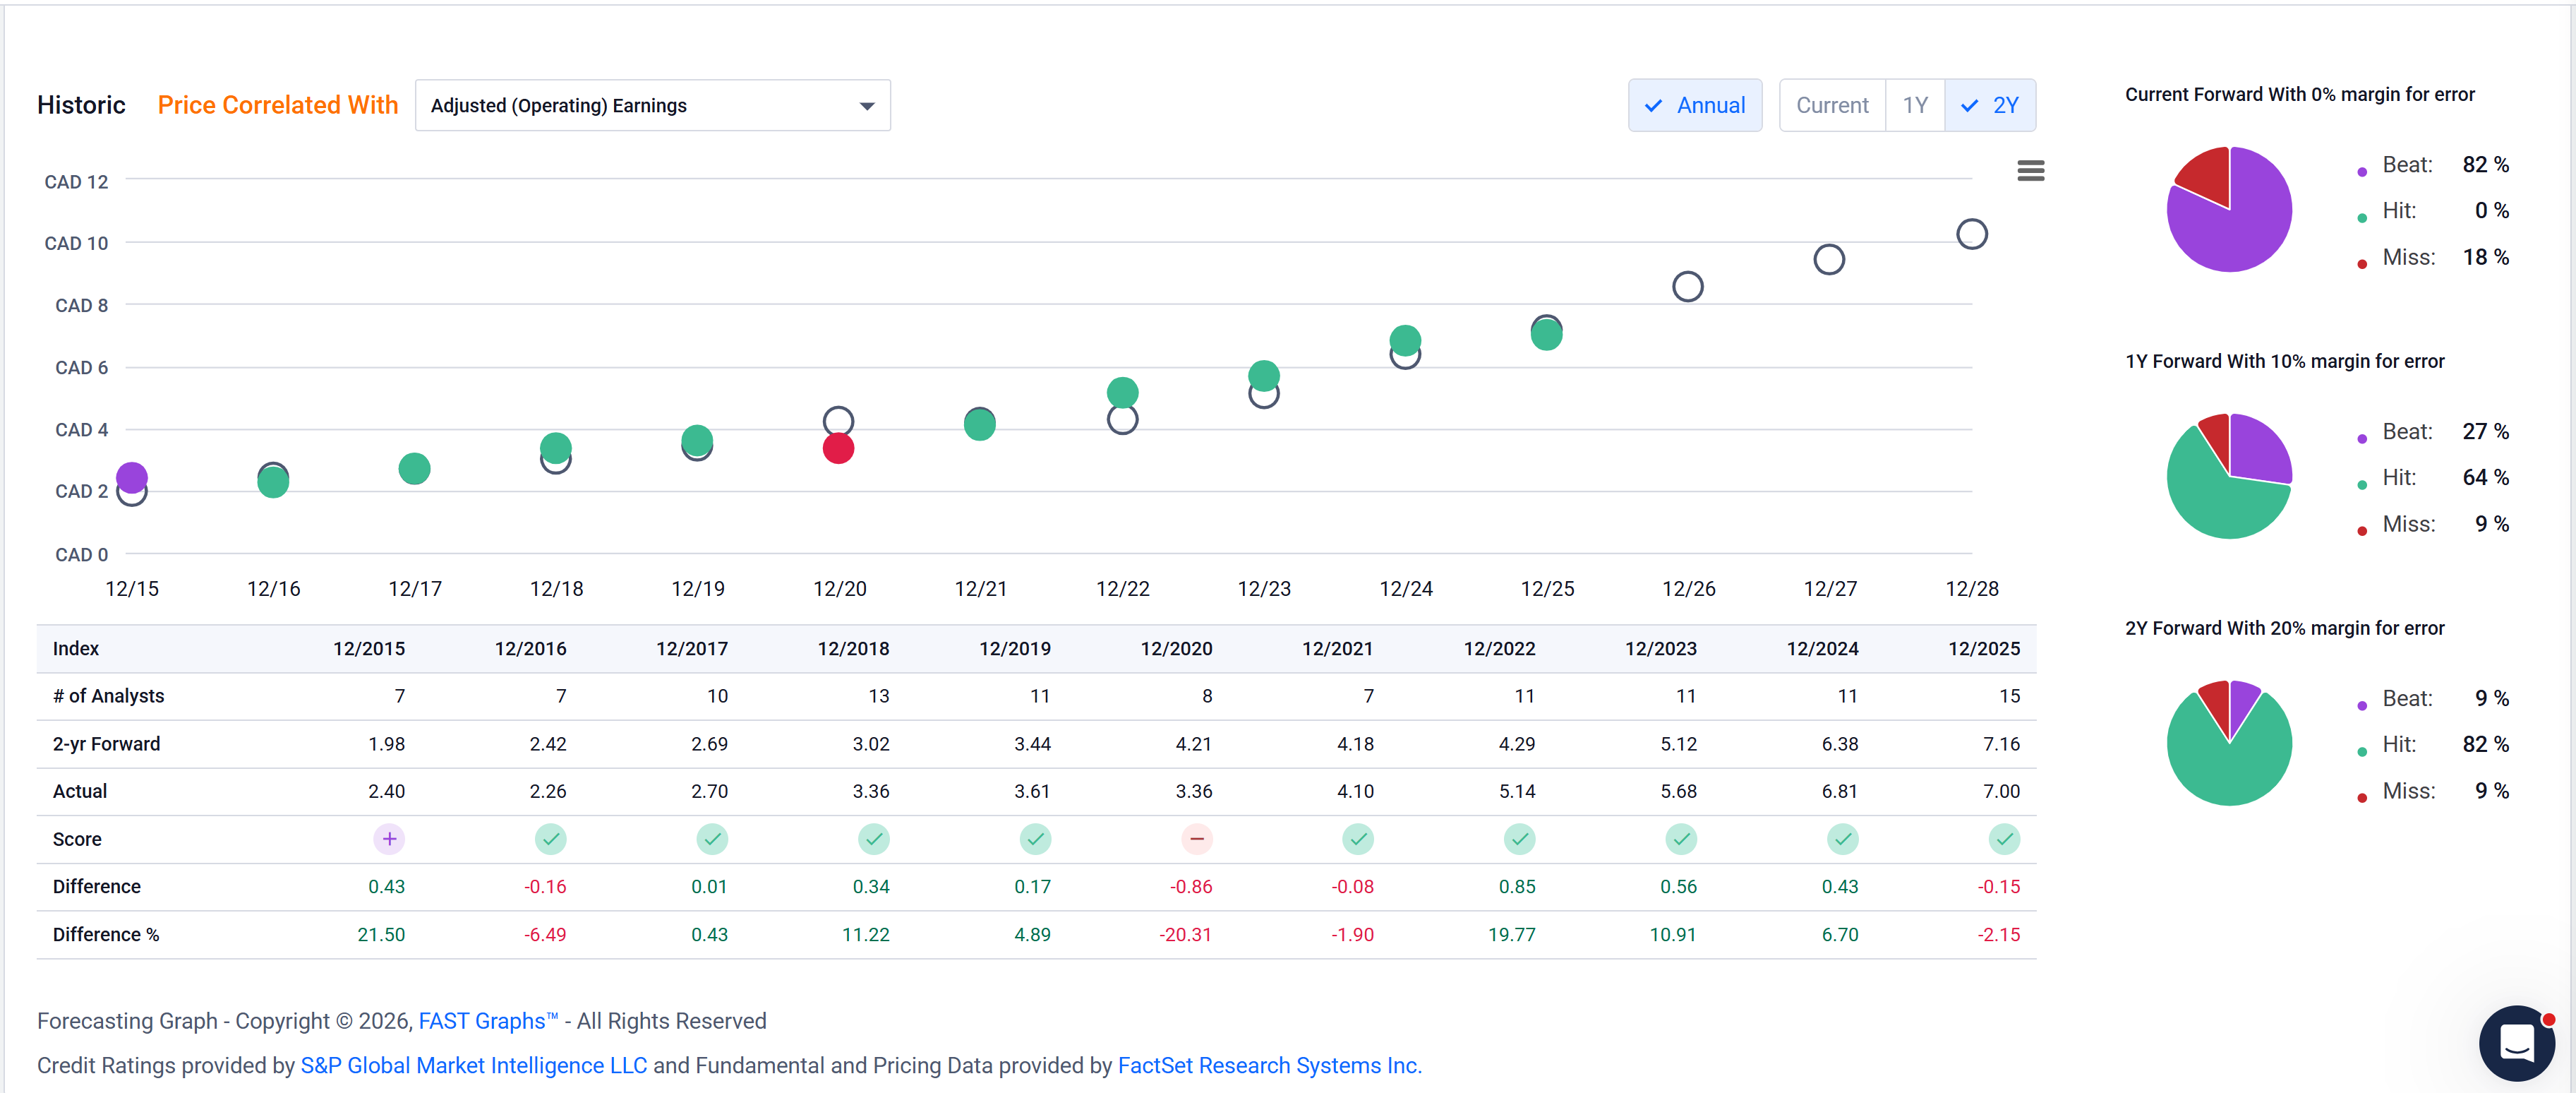
Here, we’re asking what could happen if Waste Connections delivers something close to analysts’ current operating estimates and the market eventually values those earnings within a range consistent with the company’s historical valuation.
This is not a prediction.
It is a scenario analysis that helps us determine whether today’s price offers an attractive enough potential return for the risk we’re taking.
Source: FASTgraphs
Bringing It All Together
Waste Connections has been one of the stronger-performing dividend growth stocks on our Canadian watchlist over the past decade.
Its approximately 17.4% annualized total return over that period has rivalled many traditional growth stocks while operating in a comparatively defensive industry.
Third-party research from Value Line also rates WCN highly on its quality measures. But what interests us most is what we can see in the underlying numbers.
The dividend growth record has been remarkably consistent, including double-digit increases. Free cash flow growth has been strong, while the payout ratio remains below 25% of earnings.
That combination gives the company considerable room to continue growing its dividend, provided the underlying business continues performing as expected.
What We Like
Waste Connections isn’t a stock we buy primarily for income today.
We buy it for the potential income and capital growth tomorrow.
For younger investors with longer time horizons, WCN offers the characteristics we look for in a potential long-term compounder: a defensive underlying business, a relatively low payout ratio and a history of strong dividend growth.
For retirees, its defensive business characteristics can also be attractive as part of a diversified dividend growth portfolio, although its low starting yield means it may play a different role than a higher-income holding.
The latest quarter reinforces the fundamental case. Despite recent market volatility, the underlying business continued to grow revenue, adjusted EBITDA and adjusted earnings while management raised its full-year outlook.
What We’re Watching
The biggest question is valuation.
Waste Connections has historically commanded a premium, and even after the recent decline, nobody should confuse WCN with a traditionally cheap stock.
Its starting dividend yield is also below what we typically find in many of our dividend growth purchases. That means a larger portion of our expected return depends initially on earnings growth, dividend growth and eventual capital appreciation.
Our forecasting work suggests attractive potential capital returns if Waste Connections delivers results close to current analyst estimates and trades within its historical valuation range.
Those are assumptions, not guarantees.
That’s why price matters.
Takeaway
Chuck Carnevale often reminds investors that ‘it’s a market of stocks, not a stock market.’ Even when markets are expensive or unsettled, individual companies can become attractive. Waste Connections recently gave us one of those opportunities.
Mixing lower-yield, higher-growth dividend stocks such as Waste Connections into a portfolio can complement our higher-yielding holdings.
The immediate income contribution may be smaller, but faster dividend growth and greater potential capital appreciation can provide another source of long-term compounding.
And that brings us back to the question we started with:
A quality company at a sensible price?
We think so.
We now own a 4% position in Waste Connections in our Canadian model portfolio.
And if further price weakness improves the valuation without changing the underlying fundamentals, we’ll be prepared to consider adding to the position.
Quality first. Valuation second. Patience always.
That combination has served us well as dividend growth investors, and Waste Connections is a good example of how we put that process into practice.
DGI Scorecard
MP Wealth-Builder Model Portfolio (Canada)
Annualized Total Return: +17.19% since inception
Total Return (includes dividends): +16.83 % year-to-date
Dividend Growth: 7.0% year-to-date
Growth Yield: 3.2%
(Inception May 1, 2022, to July 31, 2026. Returns are actual results of our model portfolio in CAD with dividends reinvested.)
This Week’s Highlights
The List (Canada)
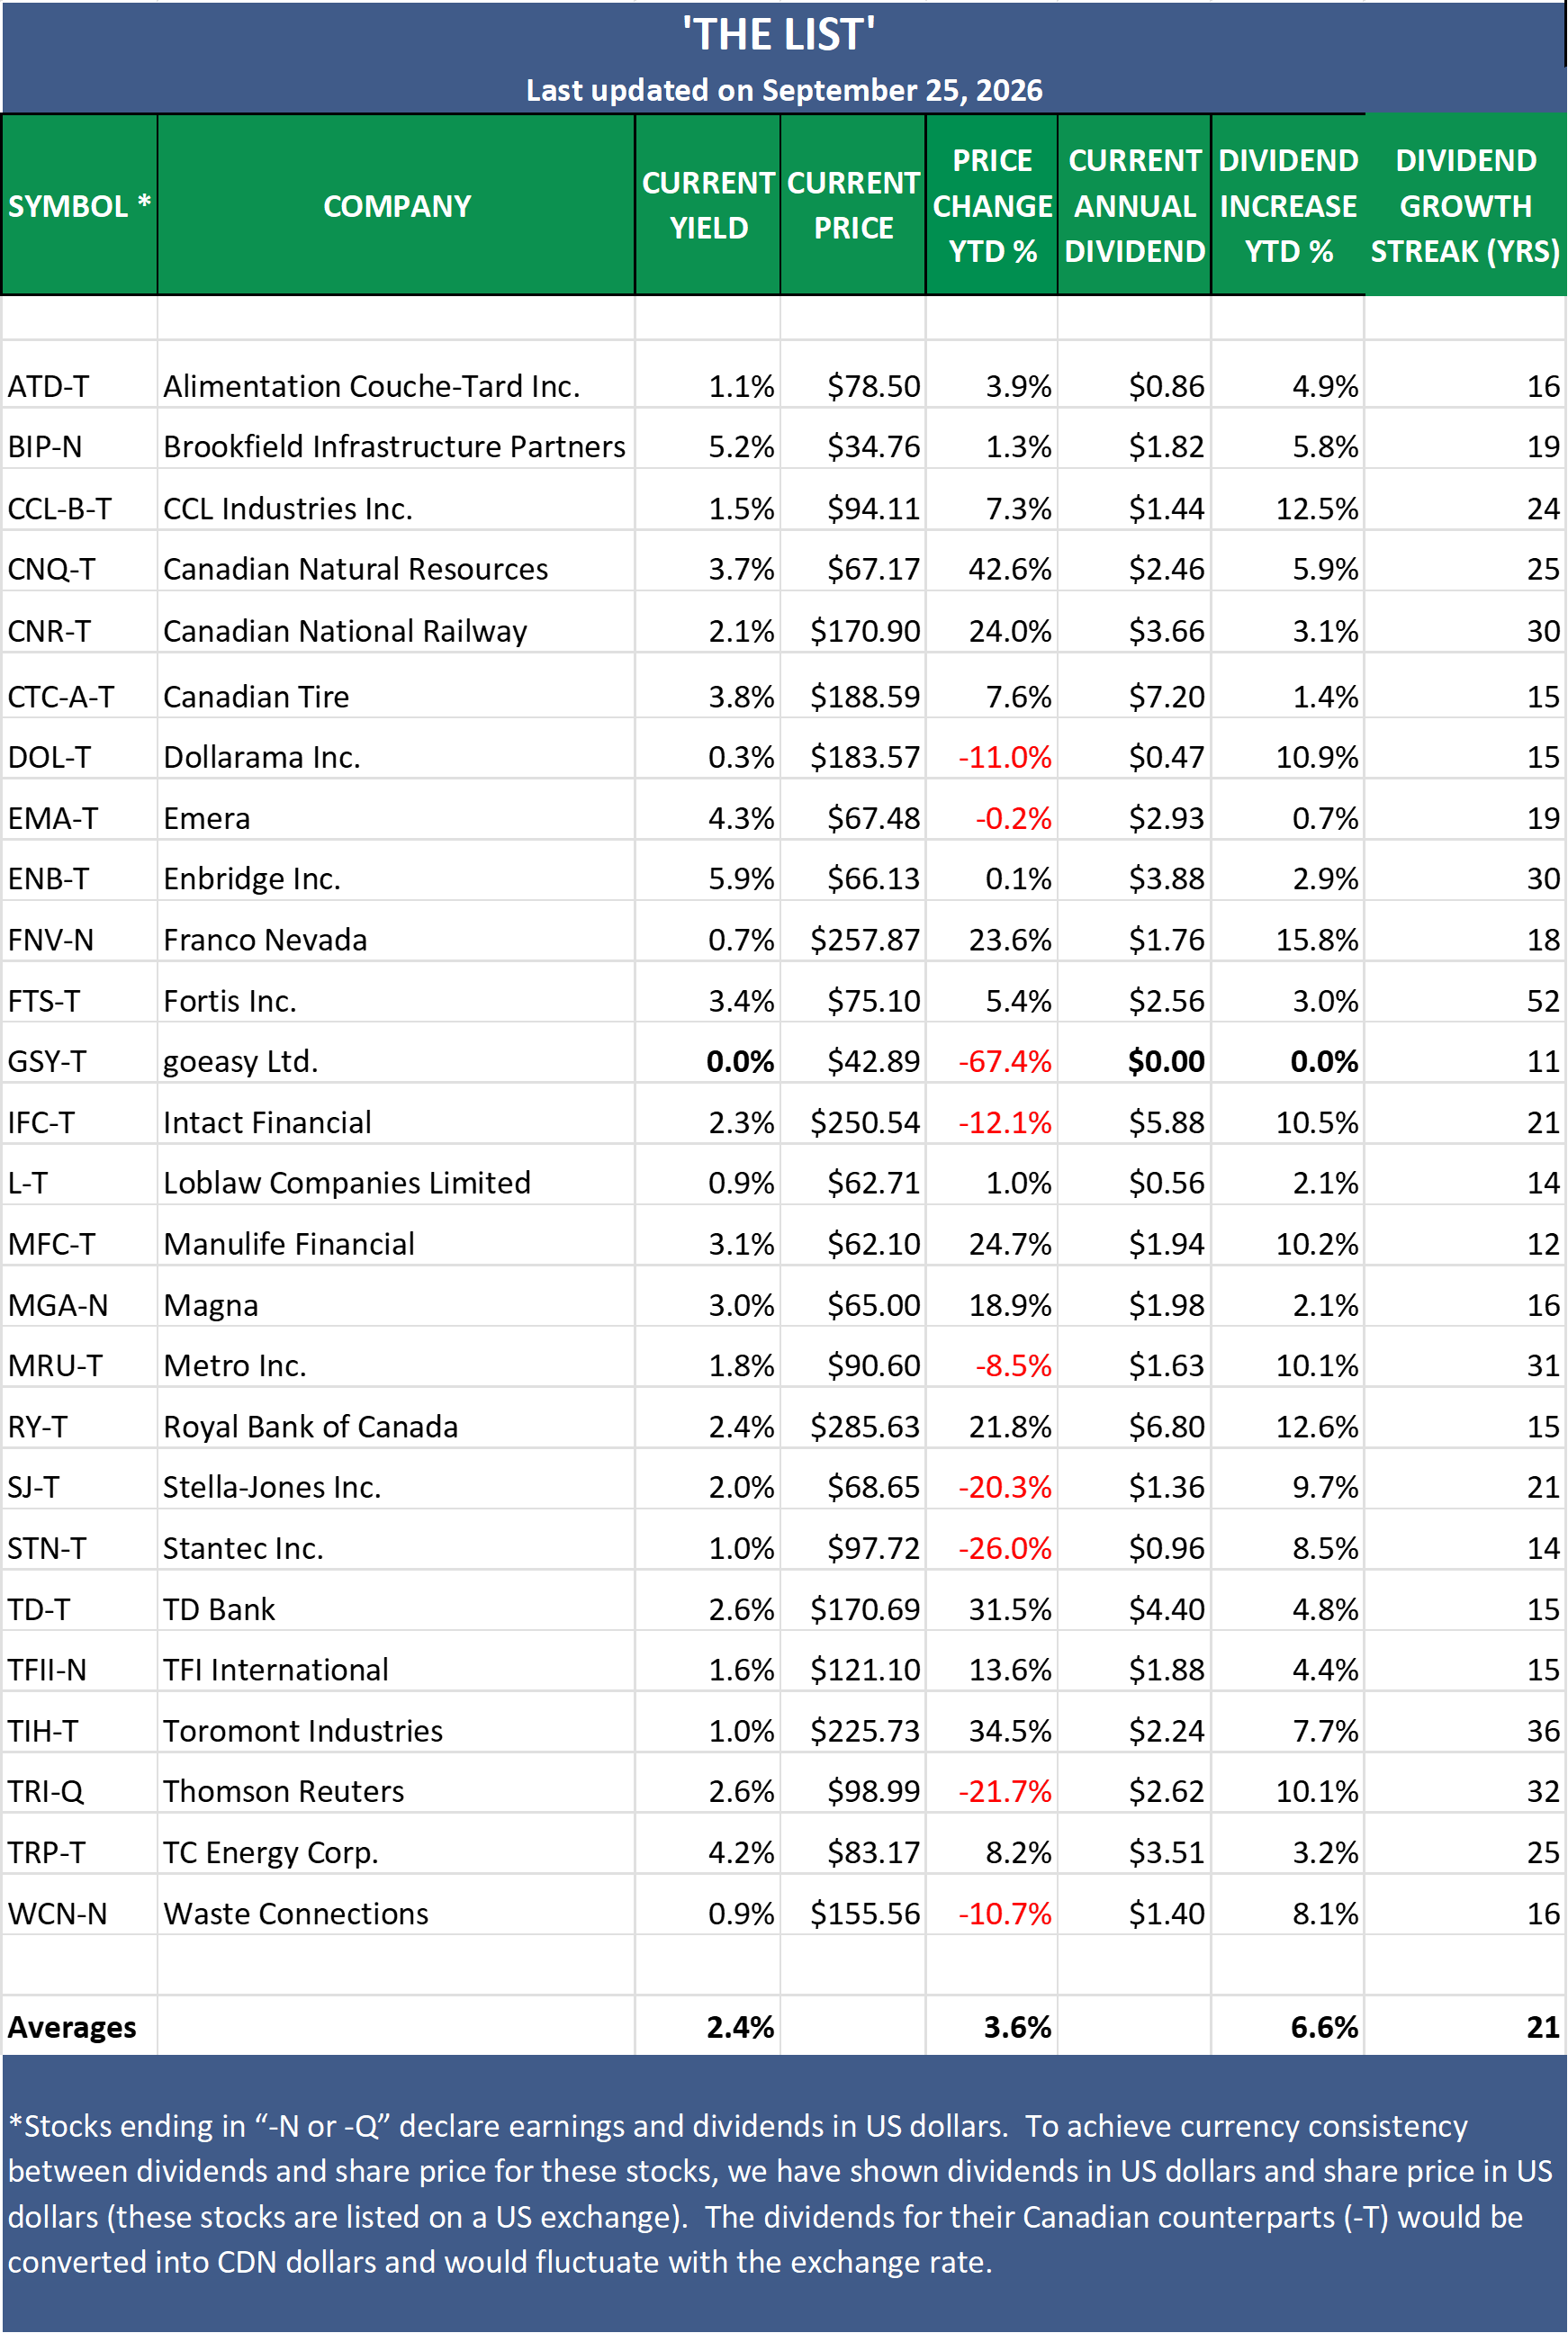
Dividend Income Growth: +6.6% year-to-date
Capital Appreciation: +3.6% year-to-date
Dividend Announcements Last Week: None
Earnings Reports Last Week: None
Earnings Reports This Week: None
Top Performers Last Week:
Toromont Industries (TIH-T), up +10.28%.
Dollarama Inc. (DOL-T), up +5.39%.
Thomson Reuters (TRI-Q), up +4.37%.
Worst Performer Last Week:
Brookfield Infrastructure Partners (BIP-N), down -3.63%.
Watchlists
The Magic Pants 2026 list (The List) includes 26 Canadian dividend growth stocks, and our new American watchlist (The List-USA) contains 28 companies. Here are the criteria to be considered a candidate on our watchlists:
Dividend growth streak: 10 years or more.
Market cap: Minimum one billion dollars.
Diversification: Limit of five companies per sector, preferably two per industry.
Cyclicality: Exclude REITs and pure-play energy companies due to high cyclicality.
Based on these criteria, companies are added or removed from The List annually on January 1. Prices and dividends are updated weekly.
The watchlists are not a portfolio but a coaching tool that helps us think about ideas and manage risk in our model portfolio. We own some, but not all, of the companies on these watchlists. In other words, we might want to buy these companies when valuation looks attractive.
Our newsletter provides readers with a comprehensive insight into the implementation and advantages of our dividend growth investing strategy. This evidence-based, unbiased approach empowers DIY investors to outperform both actively managed dividend funds and passively managed indexes and dividend ETFs over longer-term horizons.
In the last week of every month, I will show the updated watchlist for our American dividend growers (The List-USA). I will show the watchlist after the Canadian watchlist above.
New to Magic Pants?
Magic Pants Dividend Growth Investing is a behind-the-scenes look at how we build, maintain, and improve a dividend growth portfolio using real money, real positions, and real results.
Our objective is to grow dividend income by 7-10%+ annually while achieving long-term capital appreciation that matches or exceeds the broader market over a full investing cycle.
The name comes from a simple idea: when a quality company pays a dividend, cash moves from the company’s pocket to yours while your ownership stake remains intact. As earnings and dividends grow, the compounding cycle can accelerate. That’s the magic.
Build Your Own Growing Income Machine
Looking for a helping hand in the market? Members of Magic Pants Dividend Growth Investing receive exclusive ideas and guidance designed to help navigate changing market conditions.
The Magic Pants model portfolios (Canadian and American) are real-money, dividend-growth portfolios funded with actual capital and executed in live accounts. We own, size, and track every position in real time using our disciplined DGI process.
Become a paid subscriber and see exactly how we put the process into practice. You’ll also receive full access to this post and exclusive subscriber-only content.
We do the work. You stay in control.
From breaking news and quarterly earnings to the latest dividend announcements, we highlight what matters most and explain what it means for dividend growth investors.
